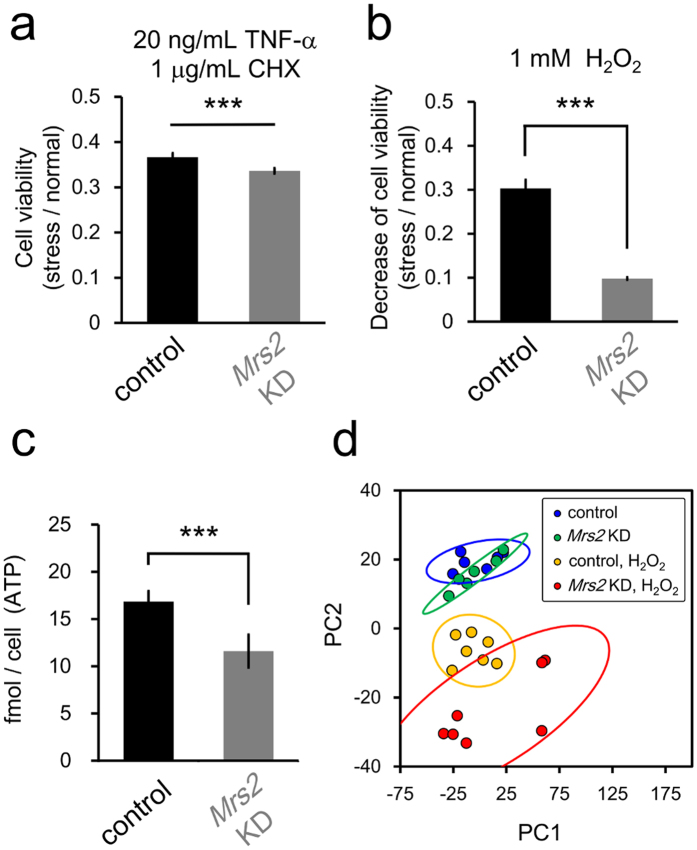
Figure 6. Mrs2 KD induced increased vulnerability to cellular stress.
(a,b) Comparison of the cell viability under TNF-α/CHX- or H2O2-induced stress between in control and in Mrs2 KD cells. In Mrs2 KD cells, cell damage (decrease rate in cell viability) in the presence of H2O2 (a) or TNF-α/CHX (b) is more severe than that in control cells (n = 12 for the control and n = 12 for Mrs2 KD samples), indicating Mrs2 KD cells are more vulnerable to cellular stress. (c) Comparison of ATP level between control and Mrs2 KD cells under H2O2 condition by metabolome analysis (n = 6 for each sample). (d) Plot of samples under 4 conditions projected onto the first two principal components (PC1 and PC2) identified PCA using all quantified 104 metabolites (n = 6 or 7 for each sample). Each circle indicates a single sample, while the larger ovals represent 95% confidence regions. Each color indicates 4 groups of conditions.

