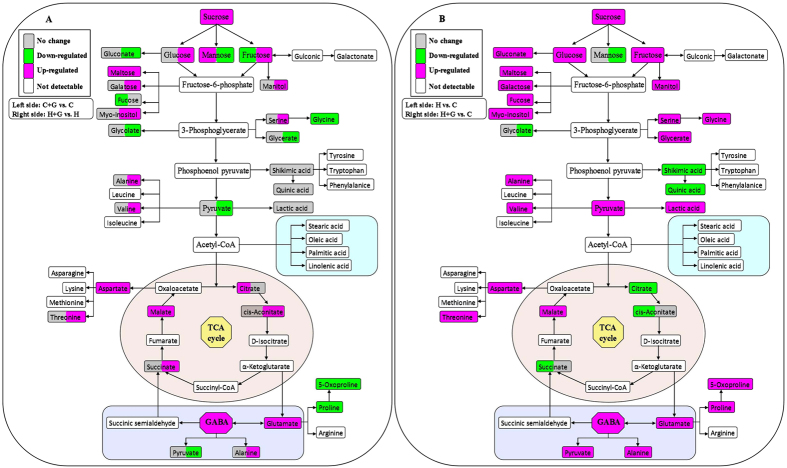
Figure 10. Assignment of the 30 metabolites from 57 assayed metabolites to the metabolic pathway.
(A) The effects of increased GABA on metabolites under control or heat condition, and the color of left side each box means C + G vs. C, and the color of right side each box means H + G vs. H. (B) The effects of heat stress on metabolites without or with GABA application, and the color of left side each box means H vs. C, and the color of right side each box means H + G vs. C. C, control; C + G, control + GABA; H, heat; H + G, heat + GABA.

