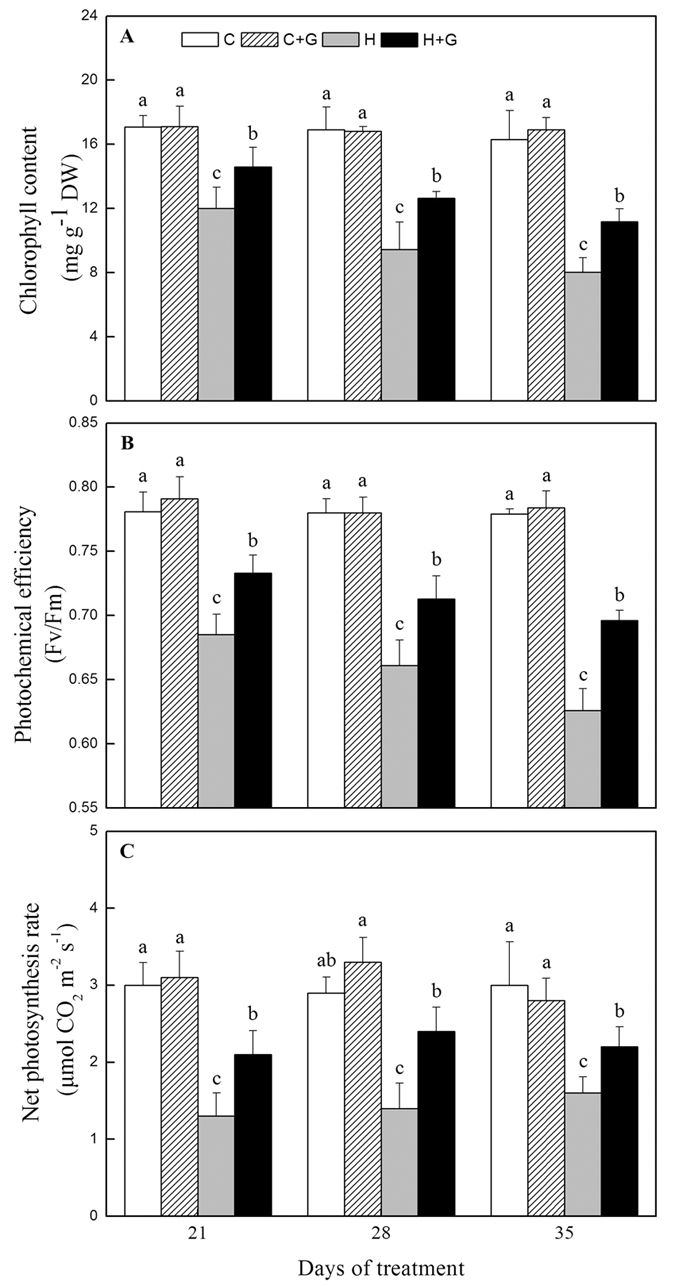
Figure 2. The effects of GABA on photosynthesis during 35 d of 21/19 or 35/30 °C condition.

(A) Chlorophyll content; (B) Photochemical efficiency (Fv/Fm); (C) Net photosynthesis rate. Vertical bars above columns indicate standard error of each mean. Different letters indicate significant difference for comparison at a given day of treatment (P = 0.05). C, control; C + G, control + GABA; H, heat; H + G, heat + GABA.
