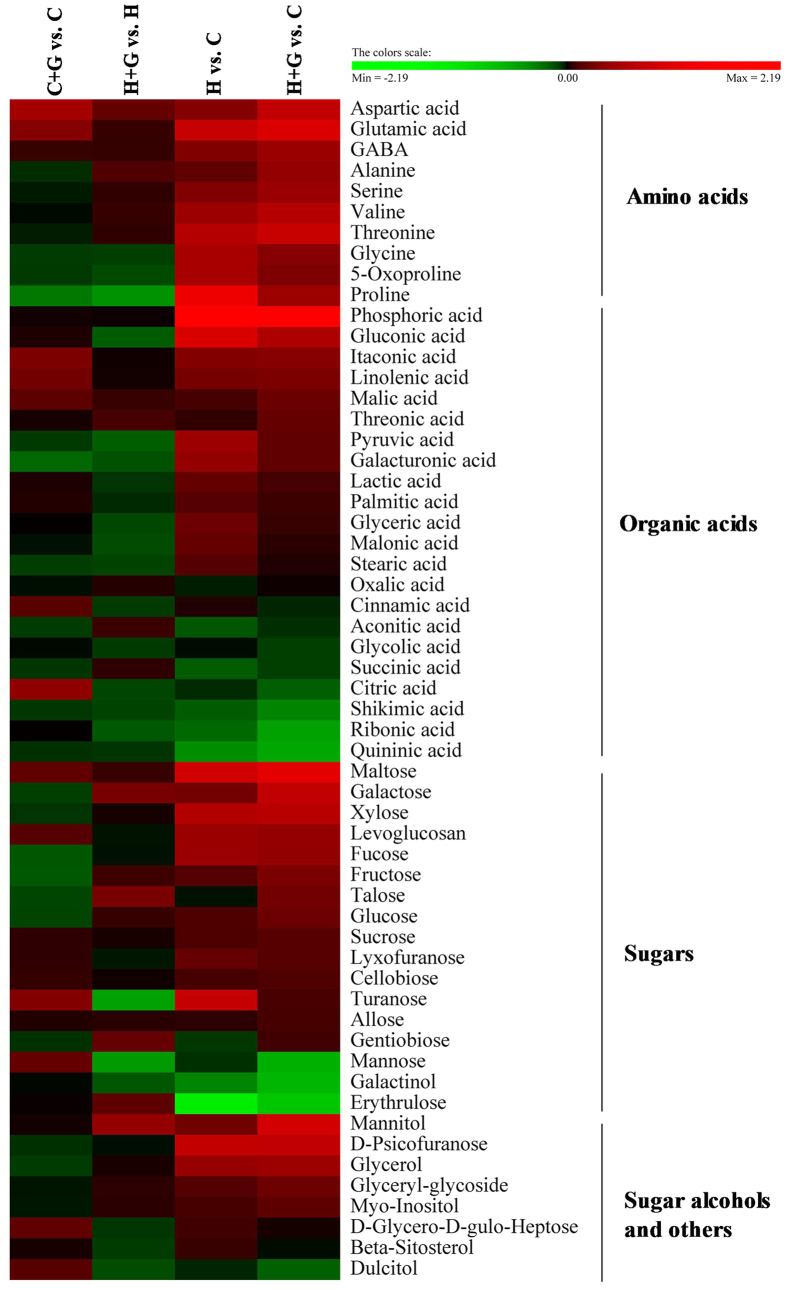
Figure 7. Heat map of changes in 57 metabolites levels in creeping bentgrass at 35 d in response to exogenous GABA application and heat stress.
The log2 fold change ratios are shown in the results. Red indicates an up–regulation, and green indicates a down–regulation. C + G vs. C and H + G vs. H implied the effects of exogenous GABA on metabolites under control or heat condition, respectively. H vs. C and H + G vs. C implied the effects of heat stress on metabolites without or with GABA application, respectively. C, control; C + G, control + GABA; H, heat; H + G, heat + GABA.

