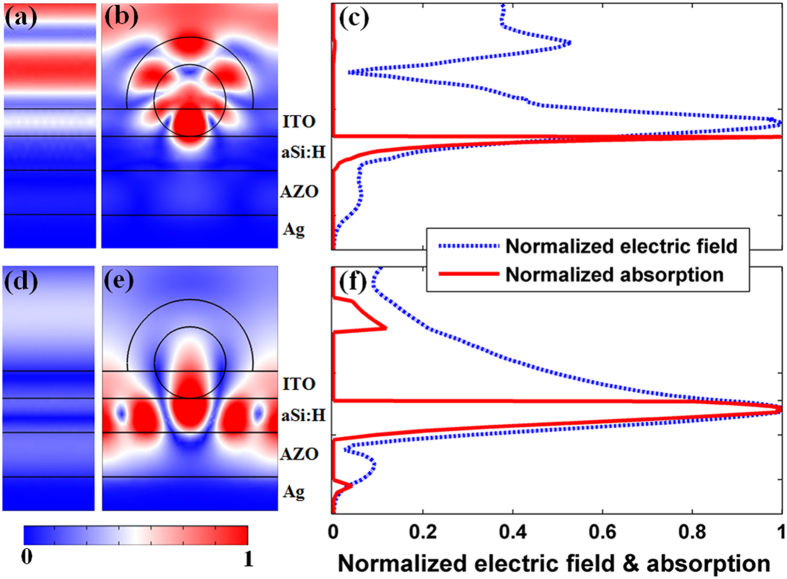
Figure 3. Electric field patterns, and electric field as well as absorption intensity versus position of the solar cells.
Cross-sectional normalized electric field distributions inside the a-Si:H TFSCs at λ = 420 nm for (a,b) and λ = 750 nm for (d,e), (c,f) are integrated electric field and calculated absorption of a cross section at the center of the sphere for TiO2-nanosphered designs.

