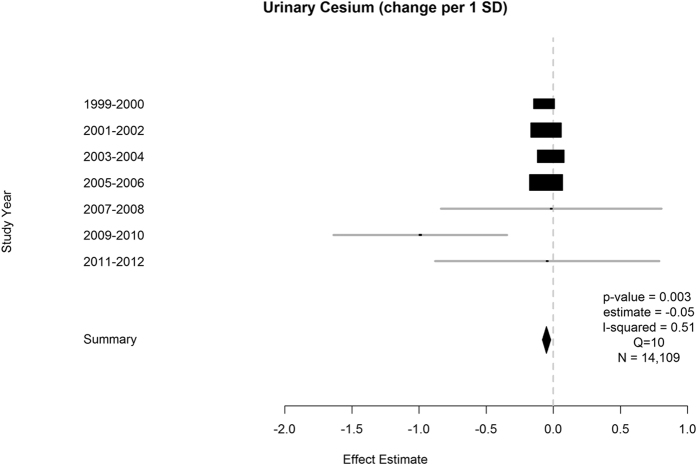
Figure 3. Significant meta-analysis result for diastolic blood pressure (1999–2012) represented by forest plot.
Additional parameters reported are years of data availability, p-value, effect estimate and total N. I-squared values and Q statistics are included as measures of heterogeneity. N = Number of measured participants.

