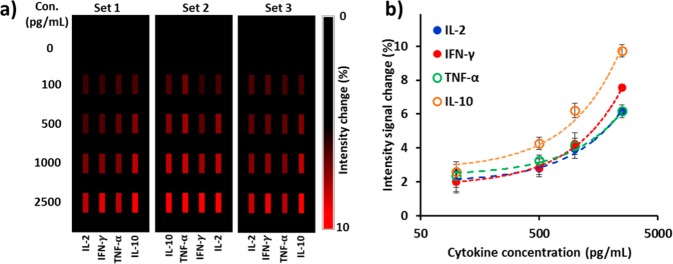
Figure 2.
(a) Mapping of intensity variations at LSPR microarray sensing spots for four different types of cytokines at different concentrations. (b) Standard curves of purified IL-2, IFN-γ, TNF-α, and IL-10 obtained from LSPR nanoplasmonic biosensor microarray chip. These curves were obtained from the intensity images in (a). Our device allows for triplicate measurements for each sample analysis with three sets of four parallel LSPR sensor stripe patterns integrated within the same detection microfluidic channel, which minimizes measurement error.

