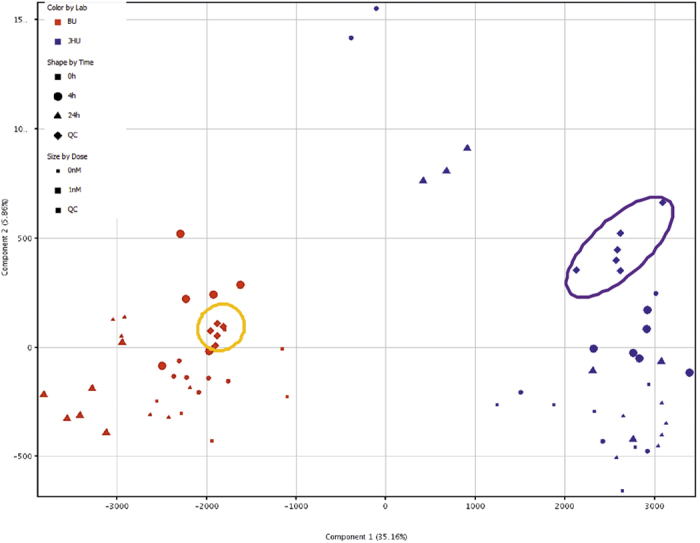
Figure 2. Principal Component analysis (PCA) of MCF-7 cells LC-MS metabolomics data from the same ATCC batch.

MCF-7 cells were treated with 0 nM or 1 nM E2 for 4 hours or 24 hours either at Brown University (BU) or Johns Hopkins University (JHU). The data point colors in the graph represent samples from Brown University and at passage number 150 (BU, red) and Johns Hopkins University at passage number 154 (JHU, blue). The shapes represent the treatment time (square: 0 h, circle: 4 h and triangle: 24 h) while the size represents the experimental condition (small: controls and big: 1 nM E2 treatment). QC samples from each were also analyzed. They represent a pool of all samples in an individual experiment (diamond). A total of 1048 features were identified in the two experiments and were used for the multivariate analysis shown here.
