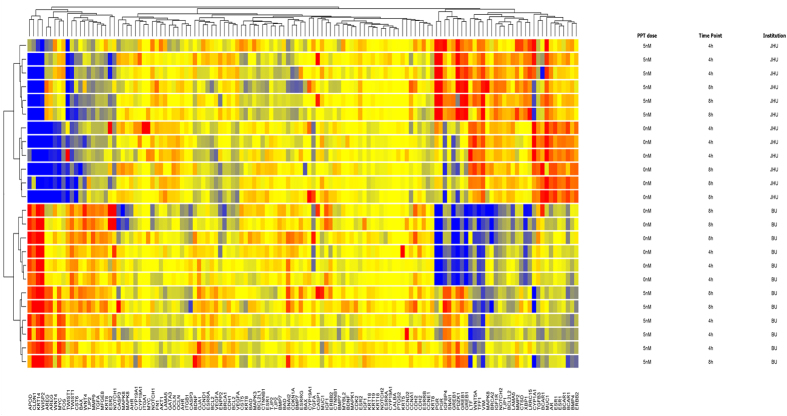
Figure 4. Unsupervised hierarchical clustering of MCF-7 cells Gene Expression microarray data from the same ATCC batch.
MCF-7 cells were treated with 0 nM or 5 nM propyl pyrazole triol (PPT) for 4 or 8 hours (cell culture details see Materials and Methods) either at Brown University (BU) at passage number 150 or Johns Hopkins University (JHU) at passage number 154. 84 genes covering estrogen receptor signaling, breast and ductal morphogenesis, cellular growth and differentiation, proliferation, tumor progression and epithelial to mesenchymal transition have been selected from the literature17. Cluster algorithm used Euclidean distances and Wards linkage criteria on entities and conditions of probes encoding genes. Gene Symbols in bottom labeling columns (often multiple probes represent each gene on microarray). Label plots on the right show conditions corresponding to PPT dose (nM), Time Point (hours) and Institution (Johns Hopkins University, JHU; Brown University, BU), respectively. Color range represents data baselined to the median and log 2 transformed. Comparing two sample from 0 (yellow) to +2 (red) or −2 (blue) would be 4 fold change.

