
Fig. 2.
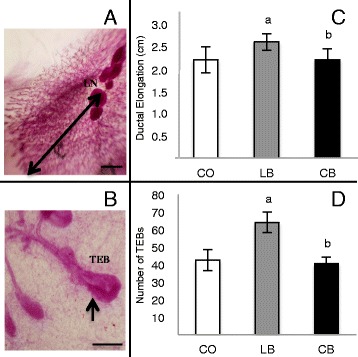
Mammary gland development of 50-day-old female offspring of control diet (CO)-, lard (LB)-, and corn oil (CB)-fed male rats. a Histological depiction of the fourth abdominal mammary gland showing ductal elongation, indicated by arrow. b Terminal end buds (TEBs), indicated by arrows. c Ductal elongation. d Number of TEBs. All values are expressed as the mean ± SEM. Statistically significant difference (p ≤ 0.05) compared with aCO and bLB, according to analysis of variance followed by a least significant difference test. The data are expressed as mean ± SEM (n = 5 per group)