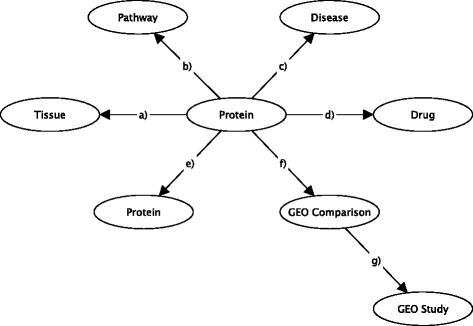
Fig. 2.

The Data Model: Schematic representation of biological information on proteins, pathways, tissues, disease and drugs, and the names of the GEO data sources, (GEO Study id, GSM sample type comparison), represented by nodes in the graph database. Relationships between these entities are shown by edges and refer to associations between: a) protein-tissue, (TISSUEENHANCED); b) protein-pathway (IN PATHWAY); c) protein-disease (BIOMARKER, GENETIC VARIATION, THERAPEUTIC, KANEKO ASSOCIATION); d) protein-drug (DRUG TARGET, DRUG ENZYME, DRUG CARRIER, DRUG TRANSPORTER), e) protein-protein (PPI ASSOCIATION, PPI COLOCALIZATION, PPI GENETIC INTERACTION, SEQ SIM); f) protein-GEO Comparison (DEG RELATED TO) and g) GEO Comparison-GEO Study (PART OF)
