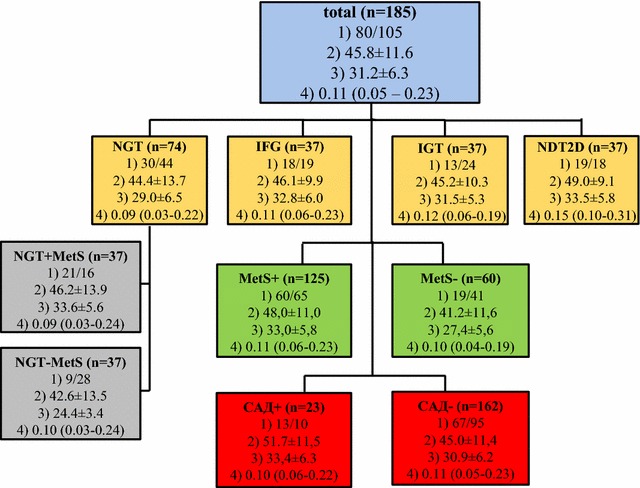
Fig. 1.

Main characteristics [number, gender distribution, mean age and body mass index (BMI)] of the participants in the groups according to glucose tolerance category—NGT normal glucose tolerance, IFG impaired fasting glucose, IGT impaired glucose tolerance, and newly-diagnosed type 2 diabetes (NDT2D), with (MetS+) and without (MetS−) Metabolic syndrome, and with (CAD+) and without (CAD−) cardio-vascular autonomic dysfunction n—number, (1) gender (males/females), (2) age (years), (3) BMI (kg/m²), (4) serum vaspin concentration (ng/ml). Data is means ± SD and median (percentile 25–75 %)
