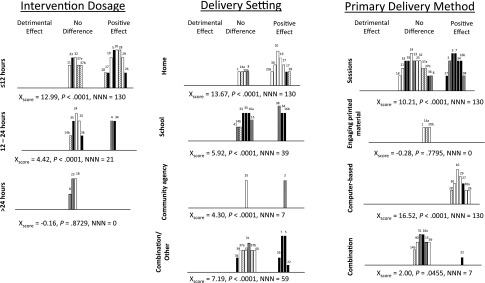
FIGURE 4.
Alcohol use at the longest follow-up time according to dose of intervention, setting, primary delivery method, and program duration. White columns, ≤12 months of follow-up; dotted columns, 12.1–24 months of follow-up; horizontal stripe columns, 24.1–48 months of follow-up; black columns, >48 months of follow-up. Taller columns represent studies with lower risk of bias. Numbers indicate study ID. Xscore, number of studies needed to be null (NNN).

