
Fig. 5.
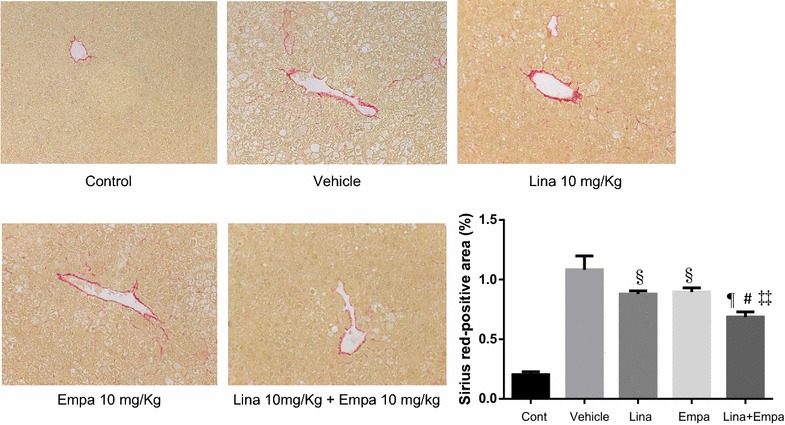
Representative microphotographs of liver sections stained with Sirius red in the liver sections and percentage in area of positive staining for Sirius red in the five groups. Data are mean ± SD. §P < 0.05, ¶P < 0.001 vs. vehicle; #P < 0.05 vs. Linagliptin alone; ‡‡P < 0.05 vs. Empagliflozin alone