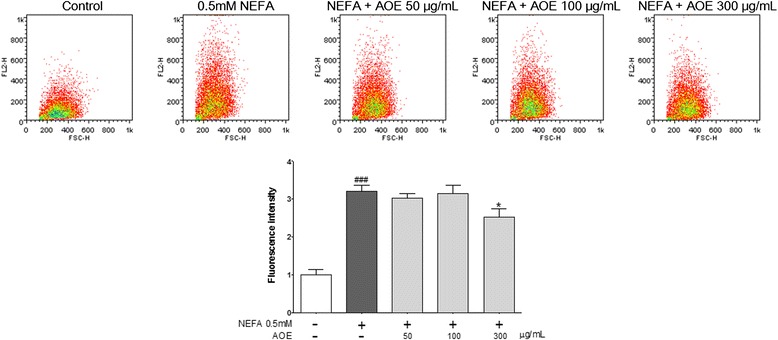
Fig. 3.

Nile red staining of HepG2 Cells and quantitative analysis of lipids. Inhibitory effect of AOE on lipid accumulation in HepG2 cell line. Nile red fluorescence was measured using flow cytometry. Fluorescence dot plot and relative fluorescence graph. Values are mean ± SEM, ### p < 0.001, compared to control, * p < 0.05, compared to NEFA-treated group. AOE, Alisma orientale extract; NEFA, non-esterified fatty acid
