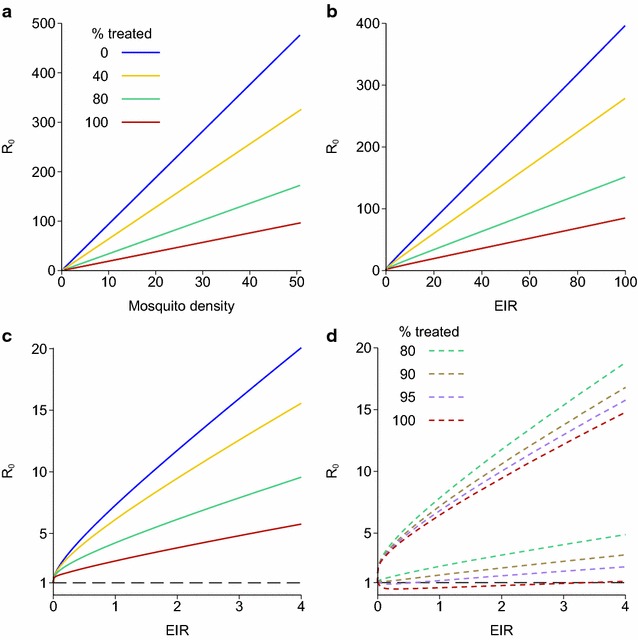
Fig. 3.

Reproduction number, EIR and mosquito density for the endemic equilibrium of the model of Griffin et al. [6]. Each line shows a different proportion of clinical cases being treated. a R 0 plotted against mosquito density per person m; b R 0 plotted against EIR; c R0 plotted against EIR—the same data as b, but only showing low EIRs; d: 95 % credible intervals for R0 based on the posterior distribution of the fitted human model parameters, plotted against EIR for high treatment levels
