
Fig. 4.
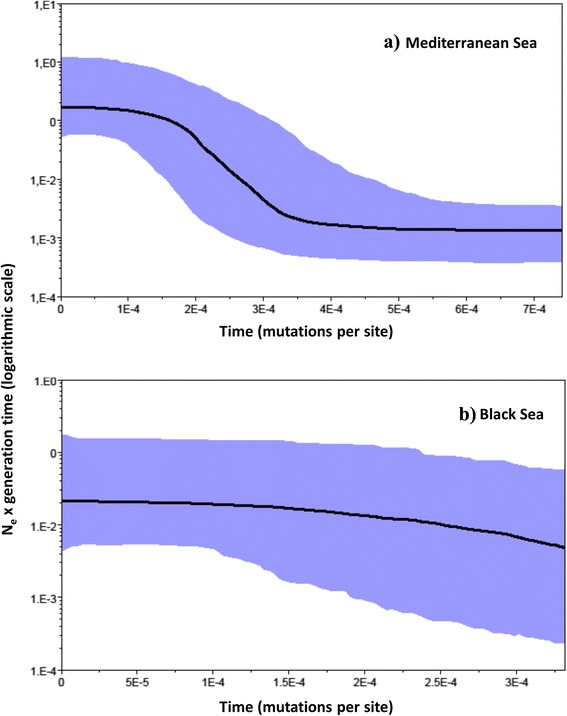
Bayesian Skyline Plots showing changes in effective population size (expressed as effective population size multiplied per generation time) over time (measured in mutations per site) for the Mediterranean Sea (a) and Black Sea (b) metapopulations. The thick solid line depicts the median estimate and the shaded area represents the highest 95 % posterior density intervals