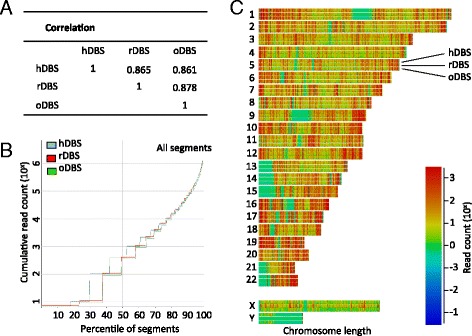
Fig. 2.

Global methylome comparison. a Three-way Pearson’s correlation between hDBS, rDBS and oDBS. b Segment trend plot depicting the accumulated number of reads (log transformed) as a function of all segments ranging from the lowest to the highest covered percentile for each of the three samples (hDBS, rDBS and oDBS). c Genome-wide domainogram showing the absolute number of all segments in the hDBS, rDBS and oDBS samples along the chromosomes using a color scheme from no segments (green) to multiple segments (dark red)
