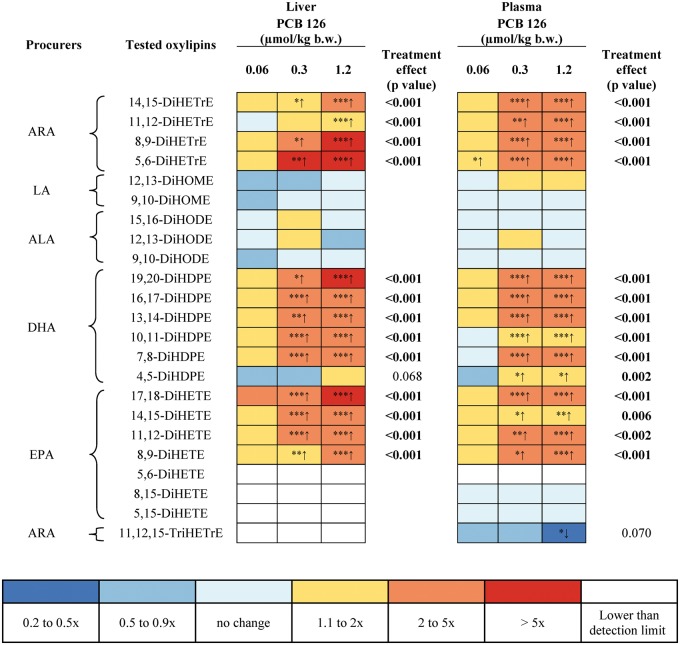
FIG. 6.
‘Heat Map’ presentation of the levels of diols in the P450 monooxygenase/sEH pathway showing dose-dependent changes in levels of this group of oxylipins in the liver and plasma of PCB 126-treated rats. Dunnett’s multiple testing correction procedure was used to compare PCB 126 treatment with the corn oil control. Significantly different from control *P < .05; **P < .01; ***P < .001. One-way ANOVA were used to test for a treatment effect.

