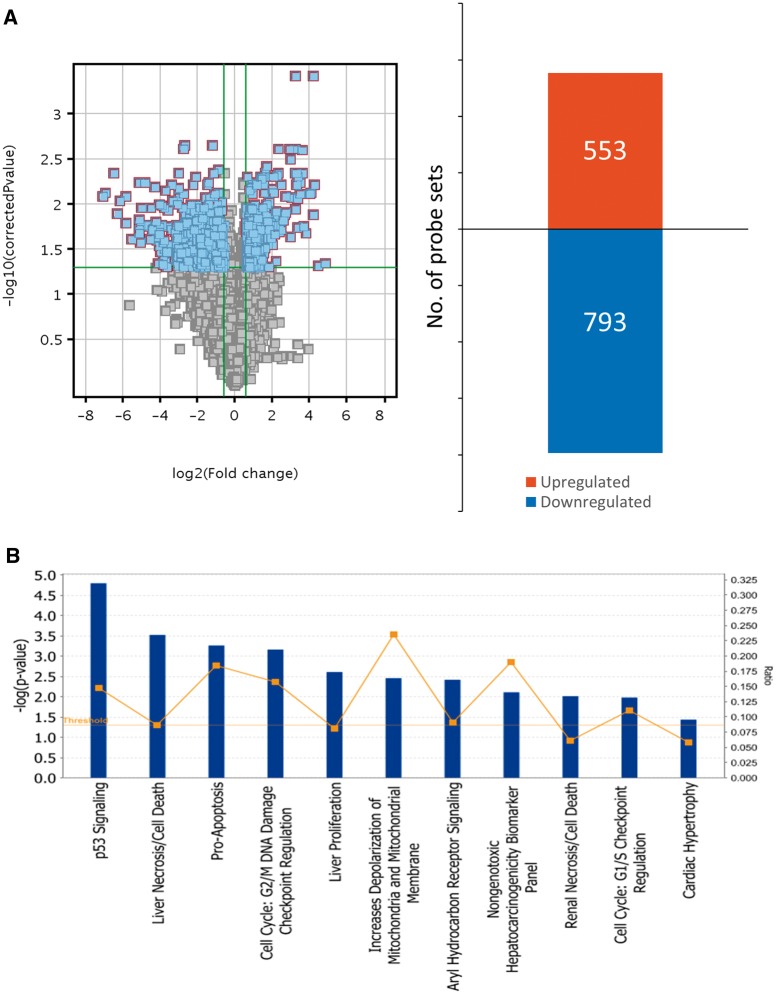
FIG. 1.
Hydroxyurea significantly impacts gene expression profiles in GD 9 embryos and activates several cell cycle and cell death related pathways. A, Left: Volcano plot of all detected entities in the microarray. Blue dots indicate transcripts that were significantly changed (-Log P-value = 1.3; P < .05) by at least 1.5-fold. Right: Bar graph of detected probes that were significantly upregulated or downregulated by at least 1.5-fold in response to hydroxyurea treatment in GD 9 embryos. B, Data collected from GeneSpring were analyzed using the Ingenuity Pathway Analysis (IPA) software to predict and examine the molecular pathways that were most affected by hydroxyurea exposure. Vertical bars indicate the level of significance of each pathway indicated by –Log P-value; boxes (▪) indicate the ratio between detected genes in the microarray and total number of known genes in the database for that pathway. Statistical analysis was conducted with the IPA software. N = 4 for each treatment group.

