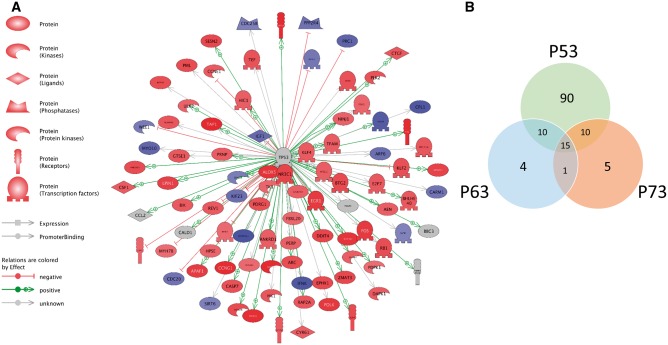
FIG. 2.
Pathway analysis predicts P53 as the most activated upstream regulator in response to hydroxyurea exposure in GD 9 embryos. A, Schematic representation of interactions between P53 and downstream targets detected in the microarray. Colors indicate the level of transcript expression as determined by the Log fold change extracted from the microarray data using GeneSpring; red denotes upregulation, blue denotes downregulation, whereas grey denotes no effect. B, Venn diagram of common and unique genes associated with the transcription factors P53, P63, and P73. Data were extracted from analysis of predicted activated upstream regulators as determined by the IPA software.

