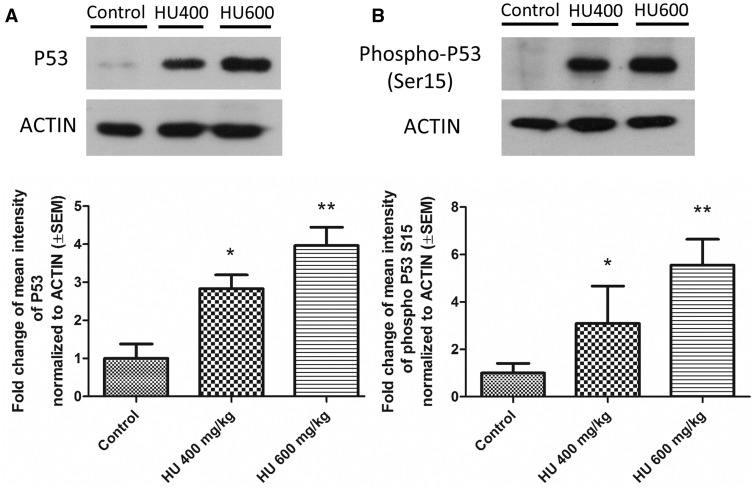
FIG. 3.
P53 and Phospho-P53 protein levels increased in a dose-dependent fashion after hydroxyurea exposure. A, Top: Representative blots of P53 protein expression. Bottom: Quantification of P53 levels in embryos from the 400 mg/kg hydroxyurea treatment group (HU400) (Fold change [FC] = 2.83, SEM = ±0.36) and the 600 mg/kg group (HU600) (FC = 3.96, SEM = ±0.48). B, Top: Representative blots of phospho-P53 protein expression. Bottom: Quantification of phospho-P53 levels in HU400 (FC = 3.1, SEM = ±1.5) and HU600 treated embryos (FC = 5.55, SEM = ±1.2). P53 and phospho-P53 levels were significantly upregulated in both hydroxyurea treated groups compared with control. All protein levels were normalized to ACTIN protein expression. N = 4–5 for each treatment group. *P < .05, **P < .01, one-way ANOVA with Bonferroni post-hoc test.

