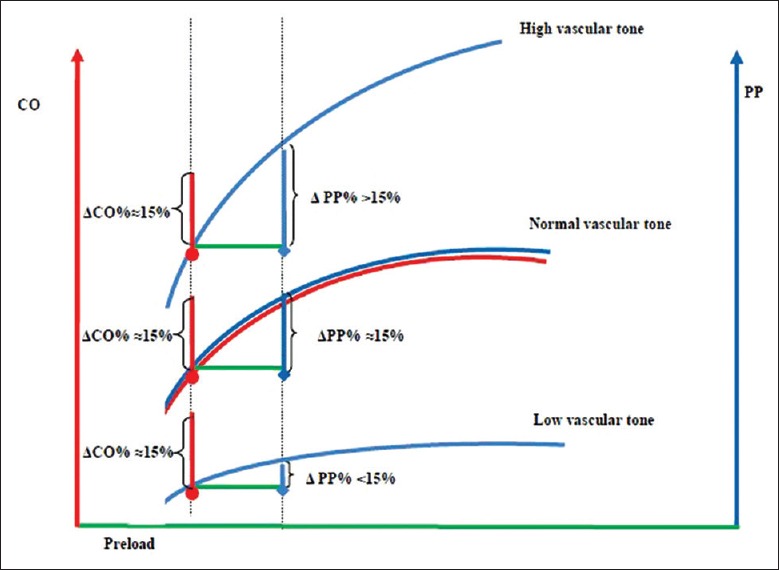
Figure 3.

Schematic representation of the cardiac output/arterial pulse pressure relationship of a high, normal, and low vascular tone in a fluid responsive condition (fluid responsiveness is defined as an increase of 15% in cardiac output by a preload stimulation according to Franck-Starling curve). CO: Cardiac output; PP: Arterial pulse pressure; ΔCO: Change of cardiac output in response to preload stimulation; ΔPP: Change of arterial pulse pressure in response to preload stimulation.
