
Figure 2.
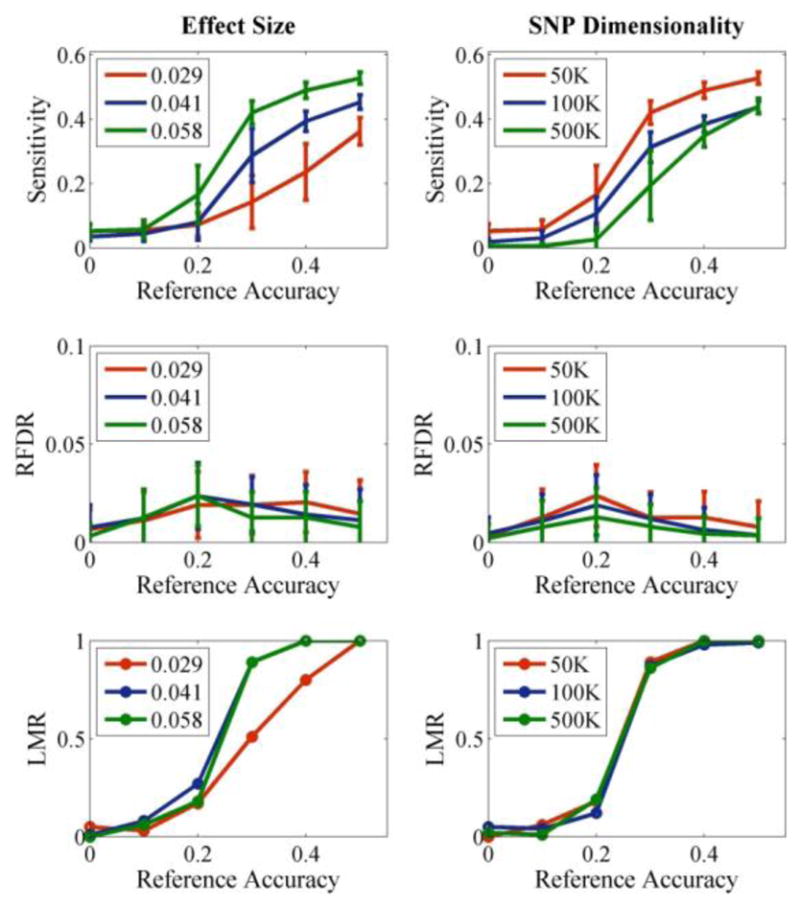
pICA-MR tested with linked 40-loci references of accuracies from 0 to 0.5. Left: varying different effect sizes when the sample-to-SNP ratio was controlled at 0.004; Right: varying dimensionality from 50K to 500K, the median effect sizes were 0.059, 0.057, and 0.060, respectively. The error bars reflect mean ± SD based on 100 runs.