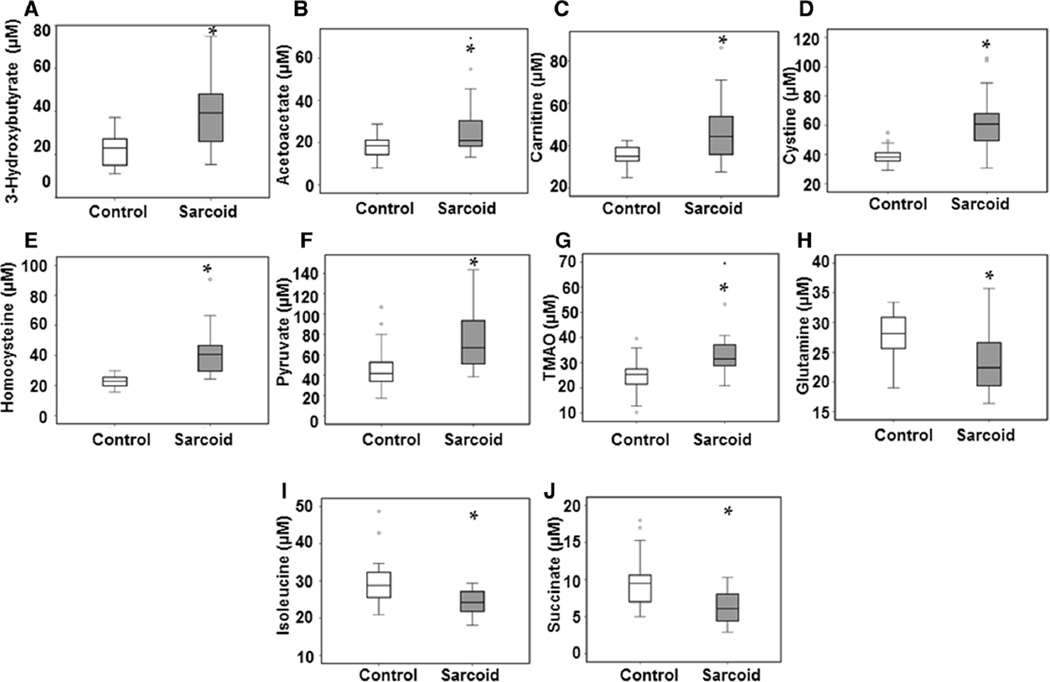
Fig. 3.
Relative levels of metabolites found to be altered in sarcoidosis patients as compared with healthy controls, represented by box plots. a 3-Hydroxybutyrate; b Acetoacetate; c Carnitine; d Cystine; e Homocysteine; f Pyruvate; g Trimethylamine N-oxide; h Glutamine; i Isoleucine; j Succinate. For the box plots, the bottom and top of the boxes represent the 25th and 75th percentile, respectively. The top and bottom bars represent the entire stretch of the data points for the subjects, except the extreme points, which are indicated with circles (o). The hyphen indicates the median value. The y axis represents the relative concentrations of the metabolites

