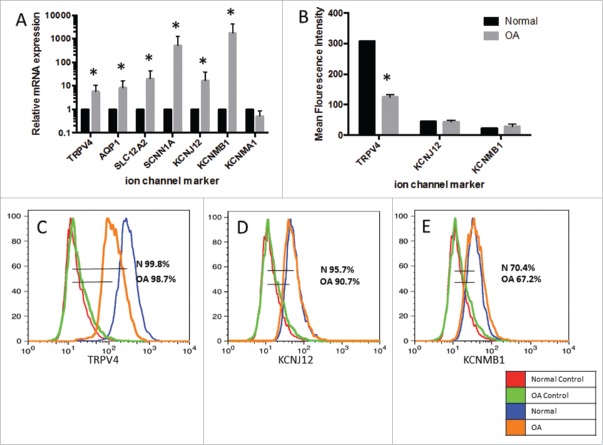
Figure 1.
Characterization of ion channel expression. mRNA expression of ion channel markers in OA sfMPC lines (n=2) normalized to the average mRNA expression of each ion channel marker in sfMPCs from normal patients (n=2) (A). Flow cytometry data for OA compared to normal patient. Mean fluorescence intensity of each sample (B). Histograms and percent expression of TRPV4 (C), KCNJ12 (D), and KCNMB1 (E).

