Figure 5.

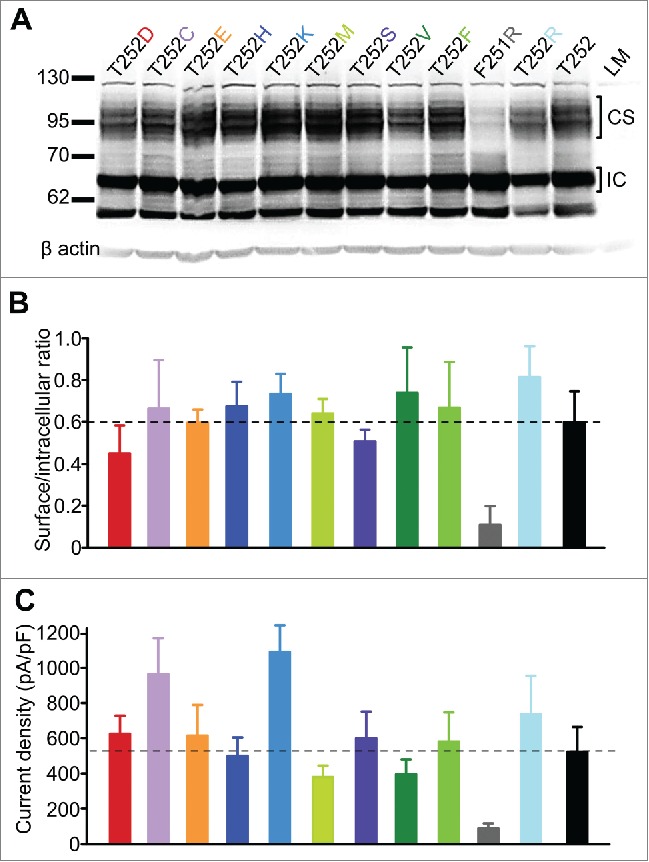
Cell surface expression and current density for a panel of different Kv1.2 S2-S3 linker mutants. (A) Representative western blot of a panel of S2-S3 linker mutants of Kv1.2. Kv1.2channels typically runs as multiple bands on the gel, characterized by a heavier ˜95 kDa glycosylated cell surface band (highlighted by ‘CS’) and a smaller ˜67 kDa intracellular ‘core’ glycosylated band (highlighted by ‘IC’). (B) Densitometry was used to measure the ratio of the cell surface band to the intracellular band (small ratio indicates weak surface expression, n = 3). No significant difference was detected between different mutations, with the exception of Kv1.2[F251R] where relative surface expression was reduced. (C) Current density at 10 mV was measured for cells expressing the panel of Kv1.2 mutant channels. In panels B and C, the dashed horizontal line is a reference for comparison to WT Kv1.2 levels.
