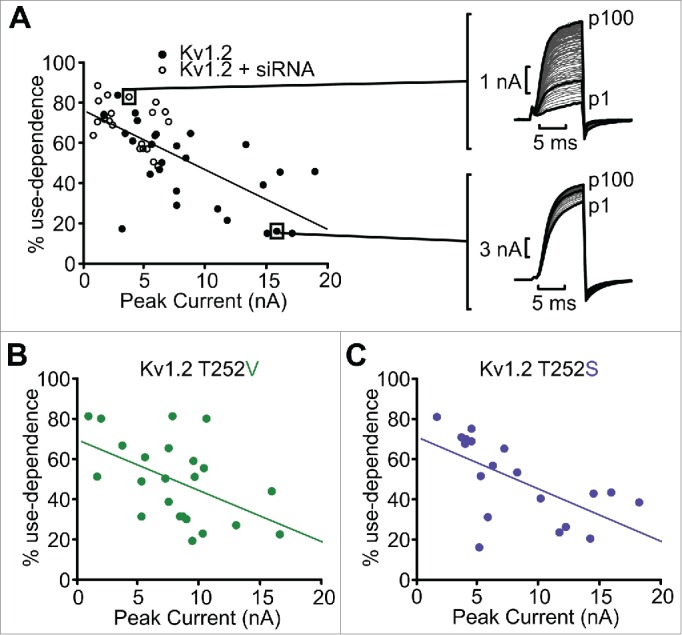
Figure 6.

Comparison of peak current to use-dependent activation in Kv1.2, Kv1.2[T252S] and Kv1.2[T252V]. (A) Relationship between peak current and % use-dependent activation, with each data point representing the current magnitude and use-dependence for a single cell. Data points distinguish between cells transfected with Kv1.2 (black circles) vs. cells transfected with Kv1.2 plus siRNA oligonucleotides (white circles). Exemplar traces illustrating pronounced use-dependence in a cell with small currents (top, co-transfected with siRNA), and weak use-dependence in a cell with large currents (bottom) are shown. Similar data were collected for Thr252 mutants that retain sensitivity to use-dependent activation: (B) Kv1.2[T252V], and (C) Kv1.2[T252S].
