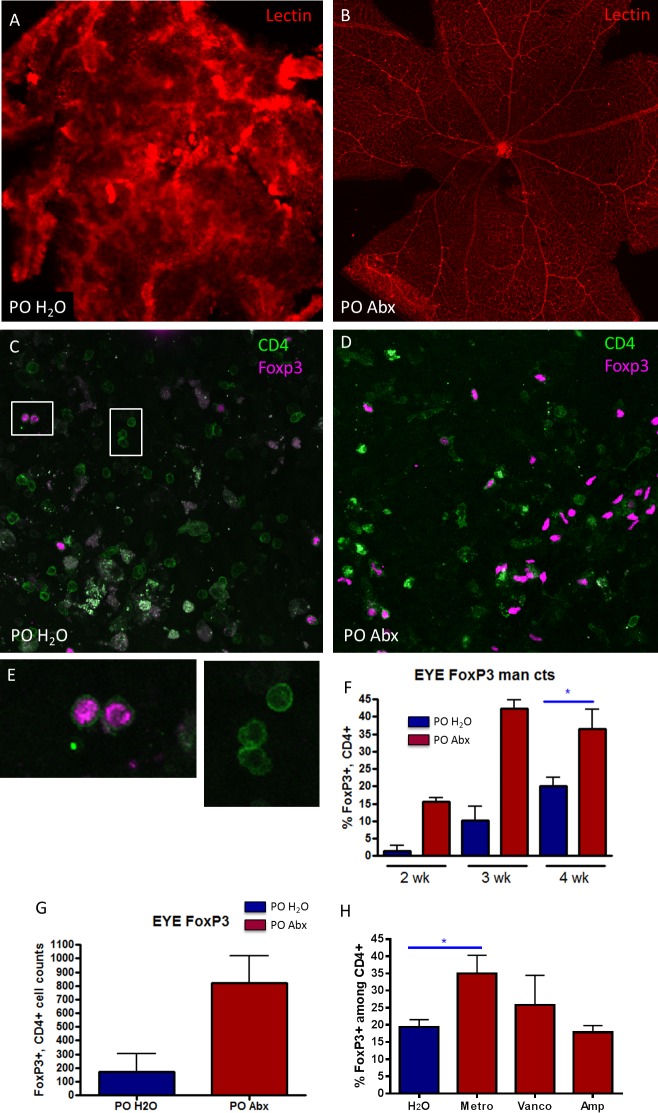
Figure 4.
Oral antibiotic-treated mice have reduced retinal vascular disruption and increased Tregs in the eye. Lectin staining of the retinal vasculature from (A) PO H2O immunized mouse showing marked retinal endothelial cell disruption compared with (B) PO Abx mice. Immunofluorescently labeled Foxp3+, CD4+ cells are more abundant in antibiotic-treated mouse retinas (D) compared with (C) water-fed mice, at 3 weeks after immunization. (E) High-magnification views of Foxp3+ and negative CD4+ cells from white boxes shown in (C) to confirm localization of staining. (F) Mann-Whitney U test of Foxp3+ cell proportions (of total CD4+ cells) in water versus antibiotic-treated mouse retinas from retinal whole mounts using Image J quantitation could be performed only at week 4 (n = 5), whereas only two mice at weeks 2 and 3 had enough inflammation to count cells. (G) Flow cytometric analysis of Foxp3+, CD4+ cells from whole eye preparations of water-fed versus antibiotic-fed EAU mice at 2 weeks after immunization. (H) Mann-Whitney U test of Foxp3+ cell proportions (of total CD4+ cells) in water versus single-antibiotic–treated mice from retinal whole mounts using Image J quantitation. (neomycin is not shown because of poor image quality due to severe inflammation); *P < 0.05, n = 2 to 5 per treatment group (± SEM shown); total cell counts are shown rather than percentages in (G). Statistics in (G) could not be performed because data were obtained from pooled eyes from n = 3 mice and run in duplicate.

