
Figure 5.
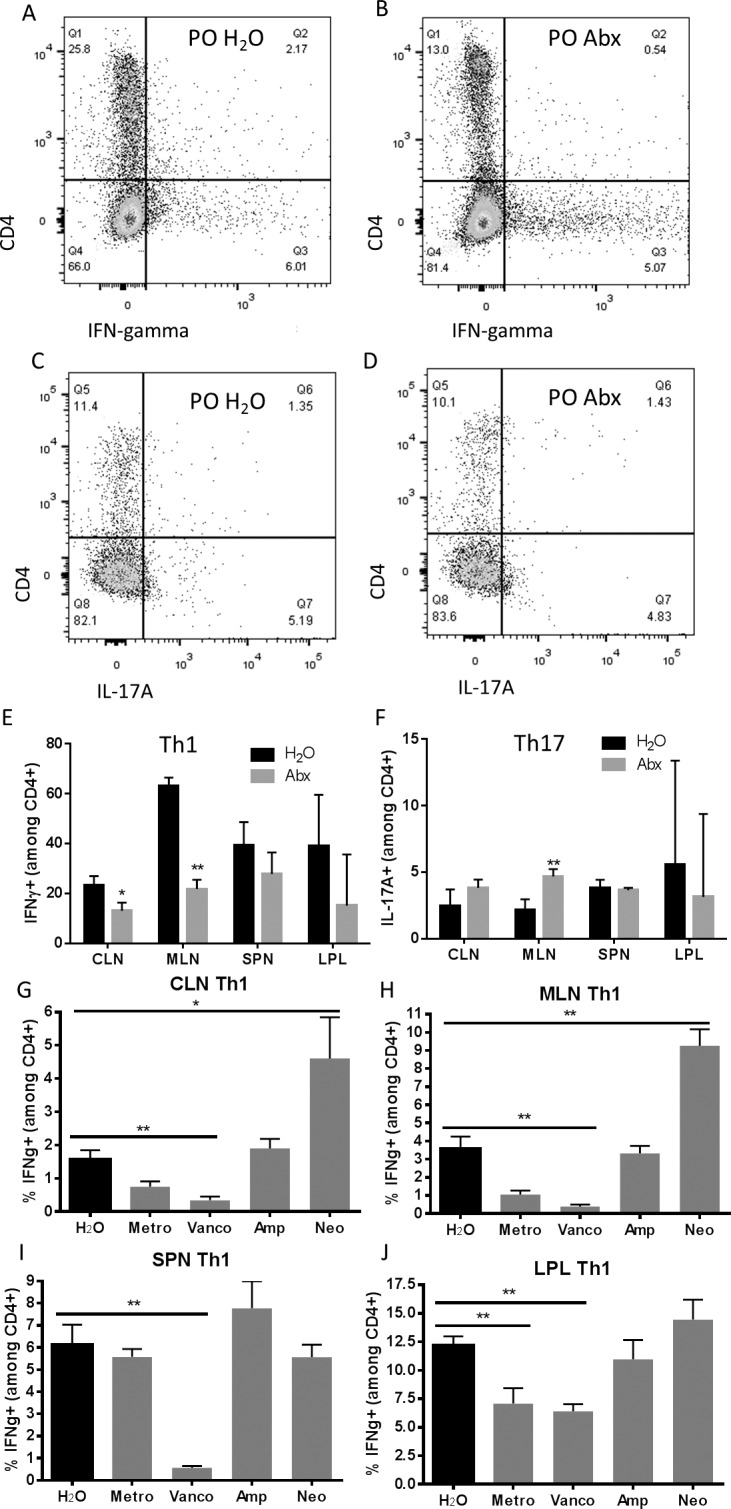
Effector T cells are reduced in extraintestinal lymph nodes in antibiotic-treated animals with EAU. Representative flow cytometry plots from the mesenteric lymph nodes of IFNγ-positive CD4+ cells in (A) PO H2O versus (B) PO Abx mice. Representative flow cytometry plots from the gut lamina propria of IL-17A–positive, CD4+ cells in (C) water-fed versus (D) antibiotic-treated animals. (E, F) Th1 and Th17 prevalence across all isolated lymphoid tissues at 1 week after immunization. (G–J) Th1 prevalence in various lymphoid tissues after single antibiotic treatments 3 weeks after immunization. IFNg, IFNγ; **P < 0.01, n = 5 per treatment group; representative of three separate experiments (± SEM shown); plots shown are gated on live cells by live/dead staining, and lymphocytes by forward and side scatter.