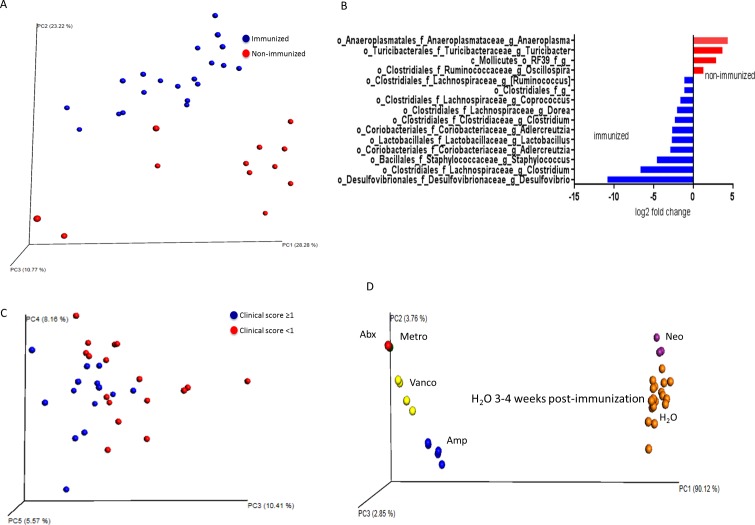
Figure 6.
Cecal microbiota changes associated with immunization, clinical score severity in EAU, and oral antibiotics in EAU. (A) Principal coordinates analysis of 16S rRNA gene sequencing from cecal contents of immunized (3 weeks after immunization) versus nonimmunized mice. (B) Deseq analysis of cecal 16S sequencing results from immunized versus nonimmunized mice. Bacteria shown are those that were differentially abundant with P < 0.05 after multiple comparisons correction. (C) Principal coordinates analysis plot of EAU mice based on clinical score severity. (D) Principal coordinates analysis plot of EAU mice based on antibiotic treatment.

