
Figure 1.
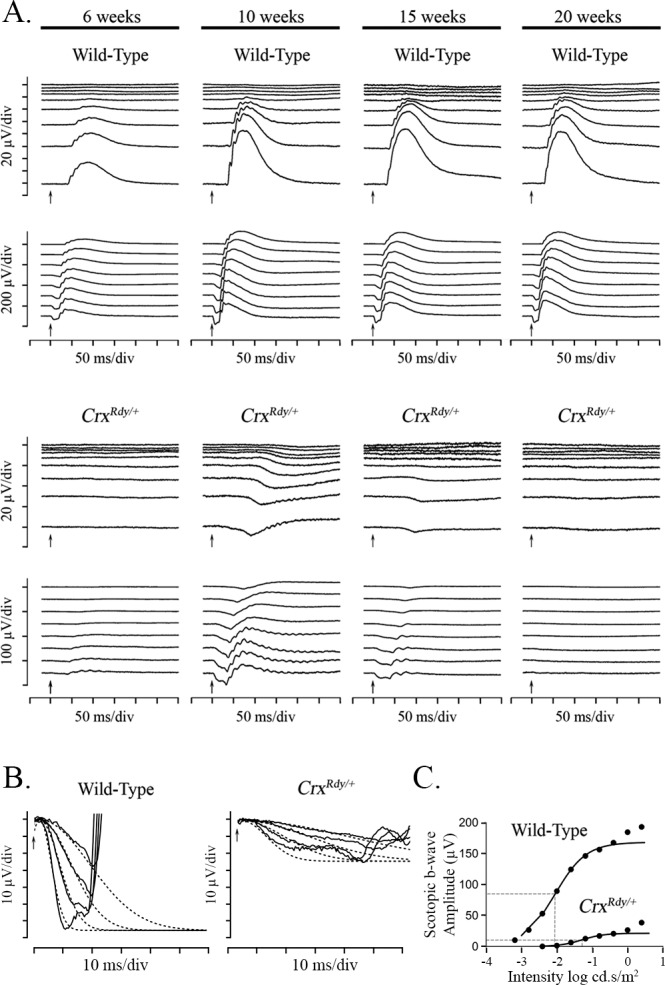
Dark-adapted luminance series ERG from CrxRdy/+ and WT kittens, a-wave modeling and b-wave Naka-Ruston fitting. (A) Representative dark-adapted luminance series ERG from CrxRdy/+ and WT kittens at 6, 10, 15, and 20 weeks of age. Flash stimuli ranged from −4.5 (top) to 1.4 (bottom) log cd.s/m2. The CrxRdy/+ kitten has very reduced (note scale differences) and delayed a- and b-waves. Oscillatory potentials were present on the b-wave of the CrxRdy/+ kitten ERG. Note the relatively large STR in the CrxRdy/+ kitten, which remains prominent to higher flash luminances than normal; the developing a-wave becoming superimposed on it. A- and b-wave thresholds occurred at similar flash luminances in contrast to those of the WT, where b-wave threshold occurred at a much lower stimulus strength than the a-wave threshold. (B) Modeling of the leading edge of the rod-isolated ERG a-wave of a representative CrxRdy/+ and a WT kitten at 10 weeks of age. The raw a-waves (solid lines) and fitted curves (dashed lines) for four flash stimuli ranging from 0 to 1.4 log cd.s/m2. Note the CrxRdy/+ kitten rod photoreceptor Rmax (maximum receptor response) is much lower than that of the WT kitten. (C) Naka-Rushton fitting of the first limb of the dark-adapted b-wave luminance:response plot of a representative CrxRdy/+ and WT kitten at 10 weeks of age. The raw b-wave data values are shown by round symbols and the Naka-Rushton fit by solid lines. ½Rmax of each waveform is represented by the horizontal dashed lines, and the luminance required to elicit a response of ½Rmax (the semisaturation constant k) is indicated by the vertical dashed lines. Note the semisaturation constant k of the CrxRdy/+ kitten is elevated by approximately 0.8 log units compared to that of the WT, and the Rmax (maximum amplitude of the first limb of the b-wave luminance amplitude plot) is very reduced.