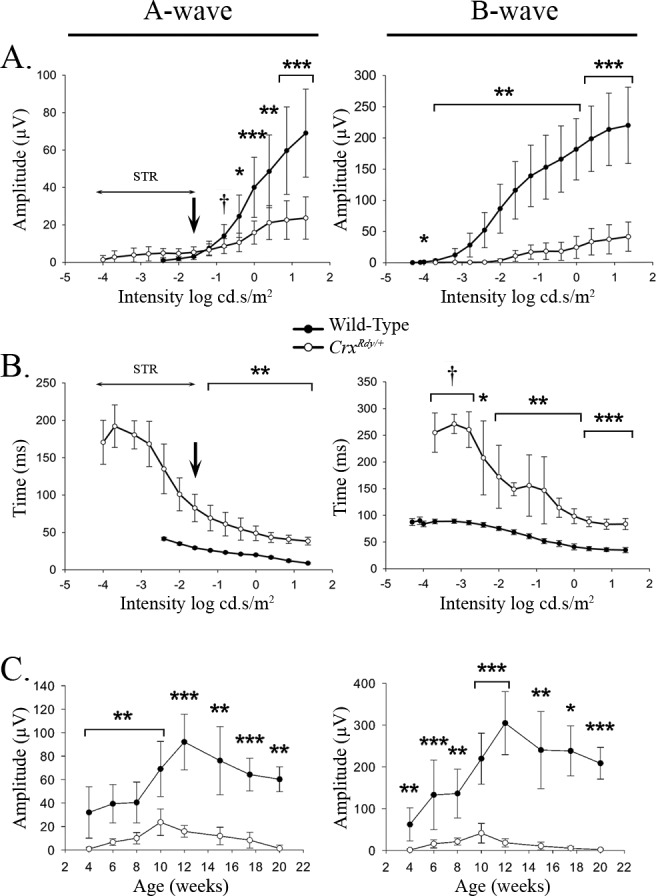
Figure 2.

A-wave and b-wave amplitude and implicit time plotted relative to flash luminance (A, B) and maximal recorded amplitude plotted relative to age (C). (A) Dark-adapted a- and b-wave luminance-response plots from 10-week-old WT and CrxRdy/+ kittens (the age at which maximum amplitudes were recordable from the CrxRdy/+ kittens). Note the CrxRdy/+ kittens had markedly reduced a- and b-wave amplitudes. The a-wave threshold was masked by the STR in the CrxRdy/+ kittens (Fig. 1A). Therefore, the negative component of the waveform at intensities lower than that indicated by the arrow in the figure consisted of the STR then with increasing intensities a combination of STR and a-wave. At intensities greater than −1.6 log cd.s/m2, the a-wave was clearly discernible. The b-wave threshold was elevated by ∼2 log units in CrxRdy/+ kittens. (B) Dark-adapted STR, a- and b-wave luminance:implicit time plots from 10-week-old WT and CrxRdy/+ kittens. Note the increased implicit times for the CrxRdy/+ kittens for both a- and b-waves. The implicit times (left plot) at intensities below that indicated by the arrow represent that of the STR. (C) A-wave and b-wave maximum amplitudes:age plots. The increase in ERG waveforms reflects retinal maturation. Peak amplitudes were recorded at 10 weeks of age for the CrxRdy/+ kitten compare to 12 weeks of age for WT kittens. By 20 weeks of age the CrxRdy/+ ERG was almost extinguished. †P ≤ 0.1; *P < 0.05; **P < 0.01; and ***P < 0.001 (n = 3 to 8).
