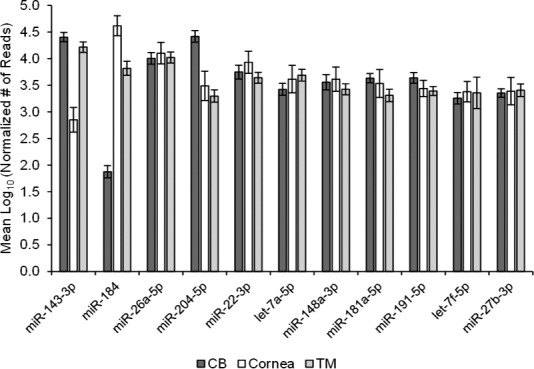
Figure 2.

Distribution of top 11 most abundant miRNAs across all human ocular tissues.
Within the specific tissues, the expression was relatively consistent in the top 11 most abundant miRNAs, with an exception of miR-143-3p and miR-184. The miRNA expressions in this figure are represented as the mean log10 of the normalized number of reads, with the error bars signifying the SEM.
