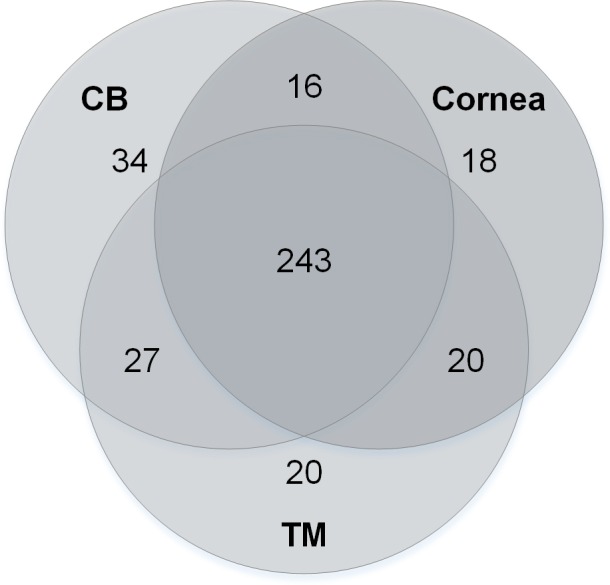
Figure 3.

Venn diagram of expressed miRNAs in postmortem human CB, cornea, and TM. To examine the miRNA content of the specific tissue types, the miRNAs were organized based on in which tissues they were expressed. The numbers in the figure indicate how many miRNAs were expressed only by the tissues indicated by the circles.
