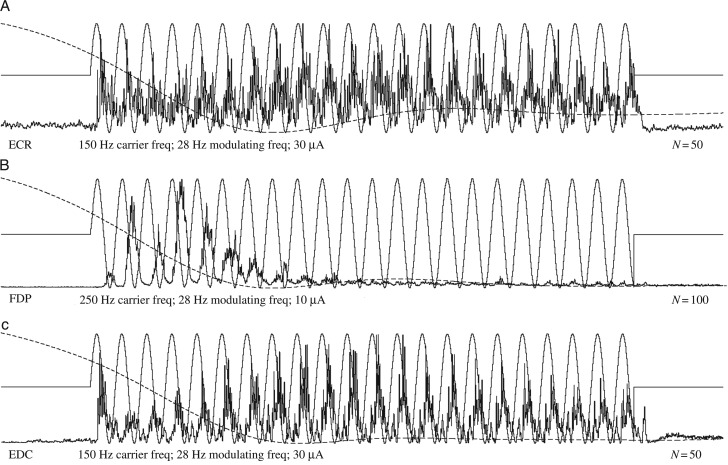
Figure 5.
(A) Consistent modulation throughout stimulation. (B) Strong excitatory responses followed by almost complete loss of modulation after about 10 cycles. (C) Waxing and waning of EMG excitatory responses throughout the stimulus train. For muscle abbreviations, see Materials and Methods. Wrist position record (gray line) is superimposed on each EMG record, and ranges from 40° ± 10 in flexion to 30° ± 15 in extension. The stimulus modulation signal is shown as a sinusoidal line superimposed on the EMG records.

