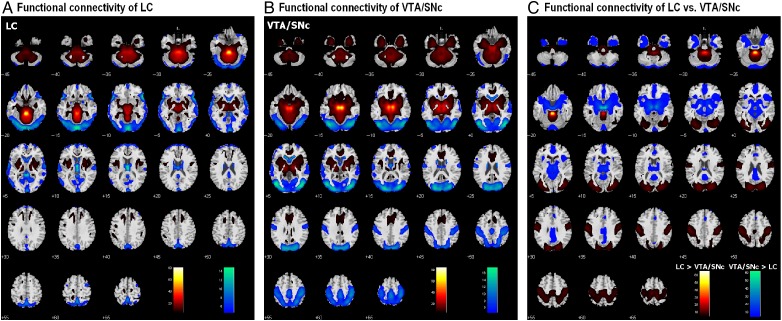
Figure 2.
(A) Brain areas that show positive (warm color) and negative (cool color) functional connectivity to the LC; one-sample t-test, P < 0.05, corrected for familywise error of multiple comparisons. (B) Brain areas that show positive (warm color) and negative (cool color) functional connectivity to the VTA/SNc; one-sample t-test, P < 0.05, corrected for familywise error of multiple comparisons. (C) Brain areas that show differences in functional connectivity to the LC and VTA/SNc: LC > VTA/SNc (warm color); VTA/SNc > LC (cool color); paired t-test, P < 0.05, corrected for familywise error of multiple comparisons.

