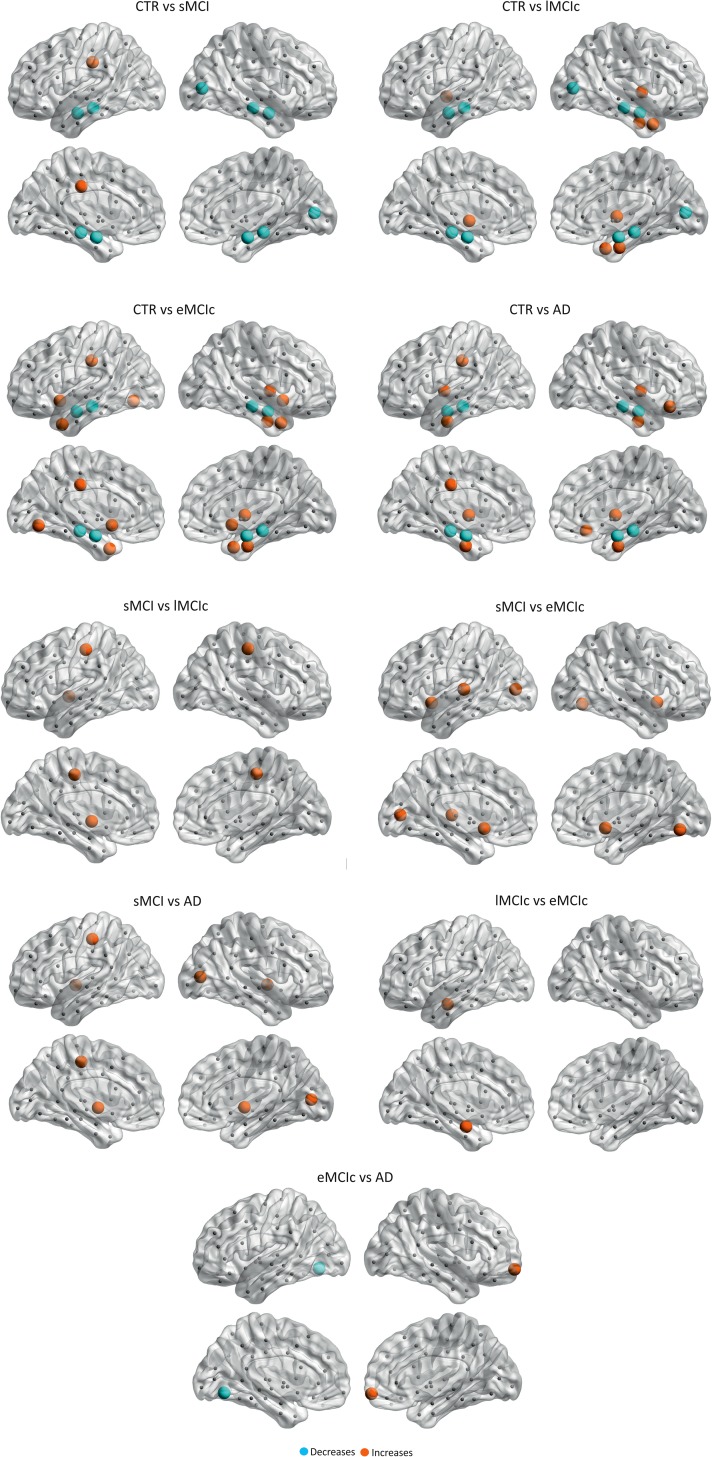
Figure 7.
Significant differences in the closeness centrality between controls and sMCI, lMCIc, eMCIc, and AD patients. CTR, controls; sMCI, stable mild cognitive impairment; lMCIc, late MCI converters; eMCIc, early MCI converters; AD, Alzheimer's disease. The regions showing significant closeness centrality decreases are colored in blue, while the regions showing closeness centrality increases in patients are colored in orange. These regions are listed in Table 3.

