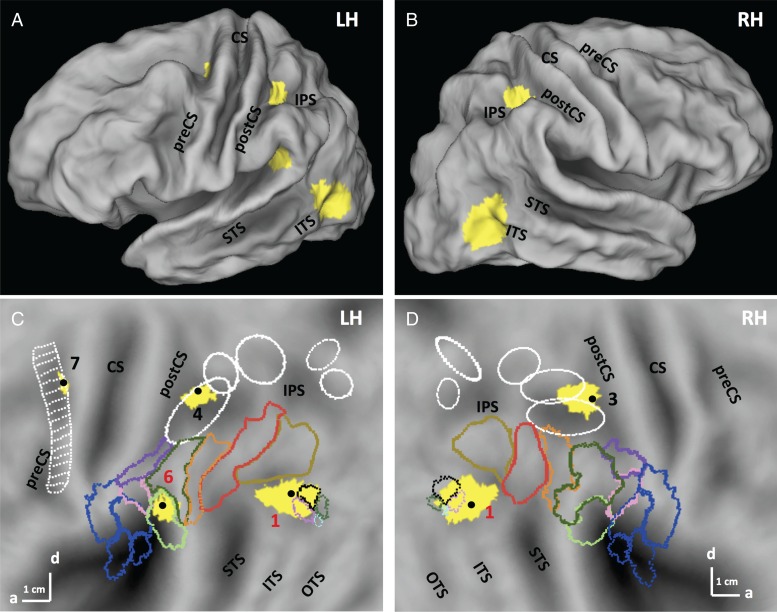
Figure 5.
SPMs showing the significant (LM FWE corrected P < 0.05) sites (yellow) for the action main effect of the first experiment in left and right hemisphere on folded brain (A,B) and flat maps (C,D). Colored outlines correspond to cytoarchitectonically defined regions: opercular regions: blue (Eickhoff et al. 2006), and IPL regions: other colors (pink: PFop, light green: PFcm, Caspers et al. 2006). White ellipses are confidence ellipses for phAIP, DIPSA, DIPSM, POIPS, and VIPS (from rostral to caudal) and white ladder-like outline: premotor mini-ROIs, from Jastorff et al. (2010). Colored outlines on the post ITS indicate the MT cluster (black: MT, purple: pMSTv, green pV4t, light blue: pFST, Abdollahi et al. 2014). Numbers: see Table 1. preCS, precentral sulcus, CS, central sulcus, postCS, postcentral sulcus, IPS, intraparietal sulcus, STS, superior temporal sulcus, ITS, inferior temporal sulcus, OTS, occipitotemporal sulcus.

