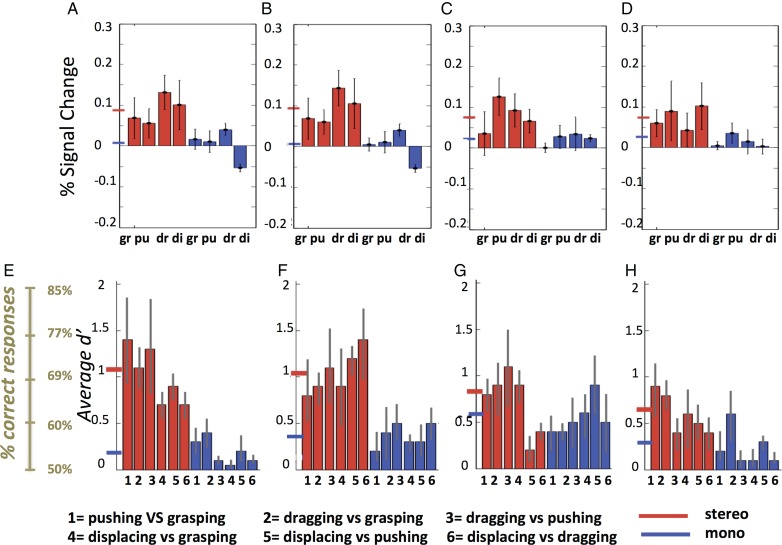
Figure 9.
Activity profiles (A–D) and d′ (E–H) for stereo- (red) and mono- (blue) actions of the stereo-action-specific regions (left PCG: A,E; left DIPSM: B,F; left dorsal RI: C,G; and left ventral RI: D,H) across the 9 subjects in the discrimination experiment. Means and SE are indicated, as well as corresponding % correct (for unbiased observers) in left lower corner. gr, grasping, pu, pushing, dr, dragging, di, displacing. Short horizontal lines on y axis: grand averages for stereo (red) and mono-conditions (blue). Repeated-measure ANOVAs for d′ distributions: main effect of stereopsis: F1,18= 9.1 (P < 0.01) in PCG, F1,18 = 8.8 (P < 0.01) in DIPSM sector, F1,18= 1.9 (P > 0.15) in dorsal RI and F1,18= 1.4 (P > 0.45) in ventral RI. Main effect of action pairs and interactions all P > 0.3. The distribution across subjects of d′ values for pairs 1, 3, and 5 in PCG are shown in Figure 4J–L. The lowest d′ values across subjects and action pairs equaled 0.45 in PCG and 0.43 in DIPSM.

