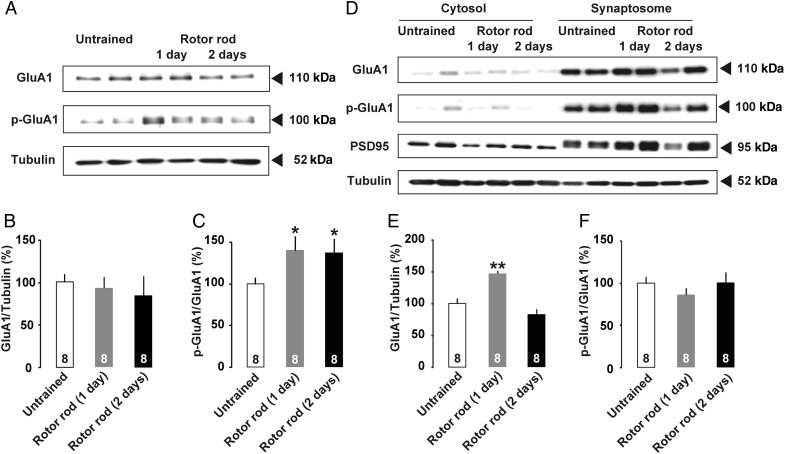
Figure 3.
(A) Trimmed cortical tissues containing surface layers of M1 (layer I–III) were analyzed by Western blot. Molecular masses of standards are indicated on the right. (B) Total GluA1 was normalized to total β-Tubulin. (C) The phosphospecific signal of Ser831 GluA1 was normalized to total GluA1. Motor training significantly increased Ser831 phosphorylation in crude tissue extracts. (D) Western blot of cytosol and synaptosomal fraction. (E) Normalized GluA1 levels in the synaptosomal fraction were significantly increased in 1-day trained rats. (F) The phosphospecific signal of Ser831 GluA1 normalized to total GluA1 did not change in the synaptosomal fraction. *P <0.05, **P <0.01 versus untrained. The number of rats in each group is shown at the bottom of each bar. Error bars indicate ± SEM.

