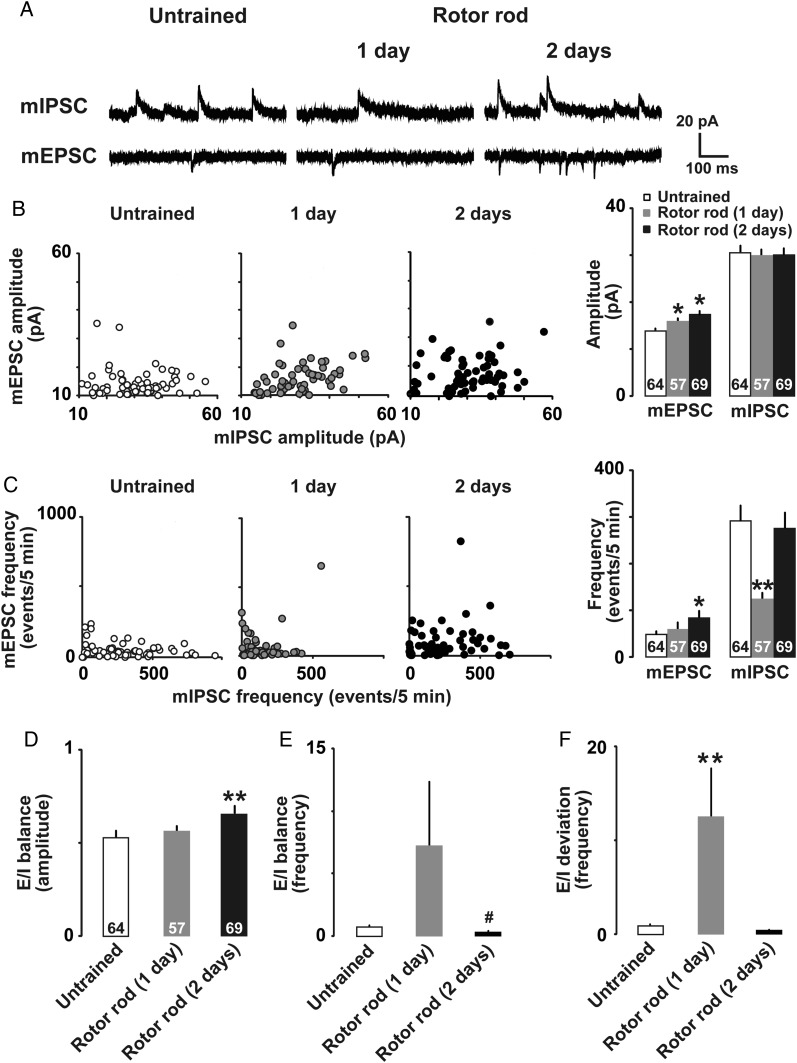
Figure 4.
(A) Representative traces of mEPSCs and mIPSCs in M1 layer II/III neurons. (B) Plots of mEPSC and mIPSC amplitudes in untrained (open), 1-day trained (gray), and 2-days trained (filled) rats. (C) Plots of mEPSC and mIPSC frequencies. (D) E/I balance for the amplitude, (E) frequency, and (F) deviation of E/I balance for frequency. *P <0.05, **P <0.01 versus untrained. #P <0.05 versus 1-day trained. The number of neurons is shown at the bottom of each bar. Error bars indicate ± SEM.

