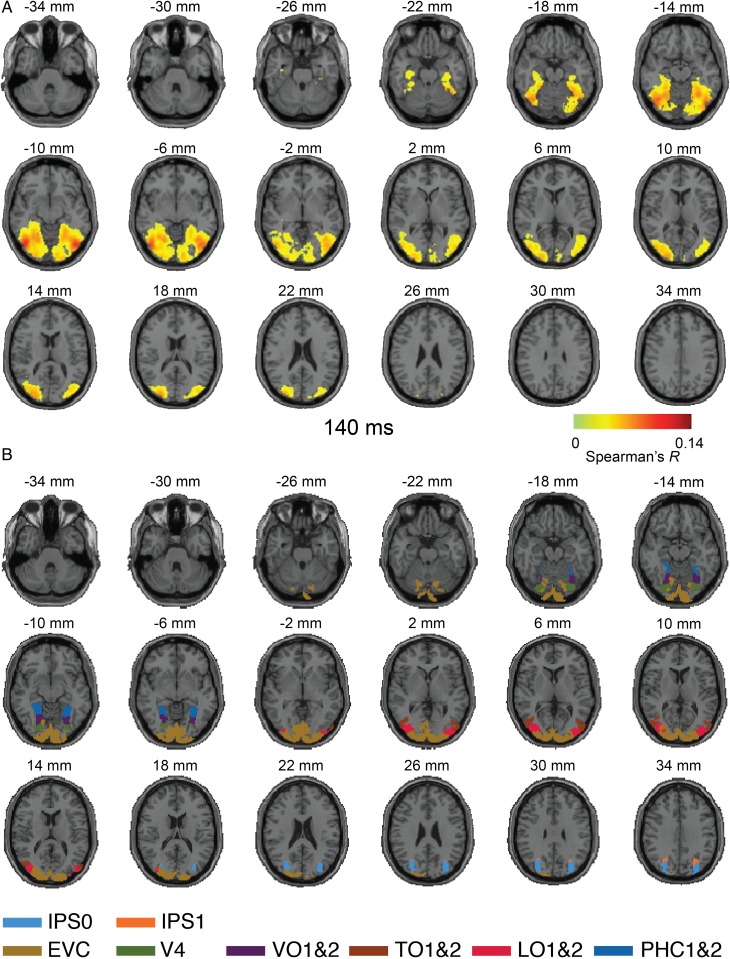
Figure 3.
Axial slices exemplifying the MEG–fMRI fusion results for Experiment 1 at 140 ms. (A) MEG–fMRI representation correlations were projected onto axial slices of a standard T1 image in MNI space. The results indicate neural activity reaching far into the ventral visual stream in temporal cortex. Color-coded voxels indicate strength of MEG–fMRI representation correlations (Spearman's R, scaled between 0 and maximal observed value, n = 15, cluster-definition threshold P < 0.001, cluster threshold P < 0.01). A millisecond resolved movie is available as Supplementary Movie 2. (B) Rendering of ventral and dorsal regions of interest from a probabilistic atlas (Wang et al. 2015).

