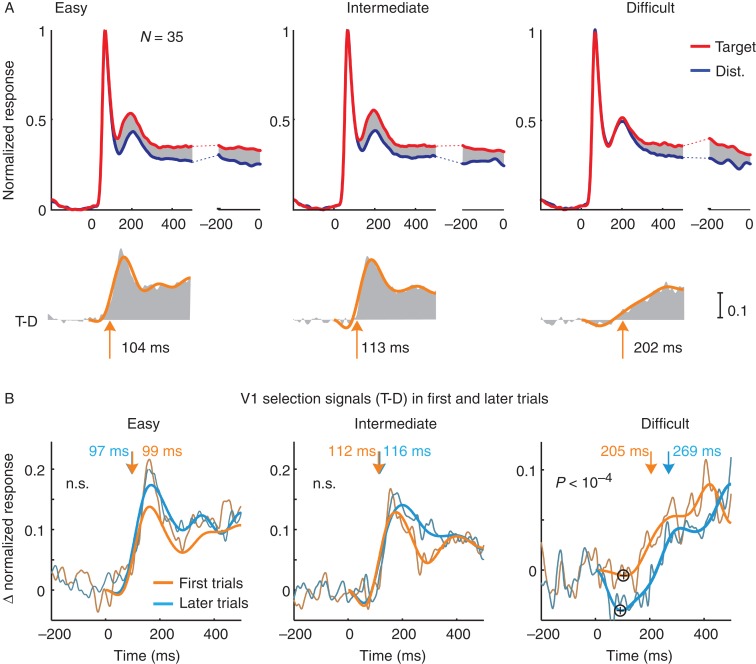
Figure 8.
Neuronal activity in V1 in the icon-selection task. (A) Activity elicited by the target (red trace) and distractor curve (blue trace), averaged across all V1 recoding sites in the easy, intermediate, and difficult condition and over both monkeys, aligned on stimulus onset (left panels) and saccade (right). Lower insets show the selection signal and a curve that was fitted to determine latency. Arrows depict latency measured as the time point where the fitted function reached 33% of its maximum. (B) Selection signal (target minus distractor response) in the first (orange) trials and later (blue) trials of the easy, intermediate, and difficult condition. The influence of learning on the onset of the selection signal in the difficult condition was significant, but it was not significant in the easy and intermediate conditions (n.s.). Plus signs in the panel of the difficult condition mark the inversion of the selection signal, that is, when the target curve elicits weaker activity than the distractor.

