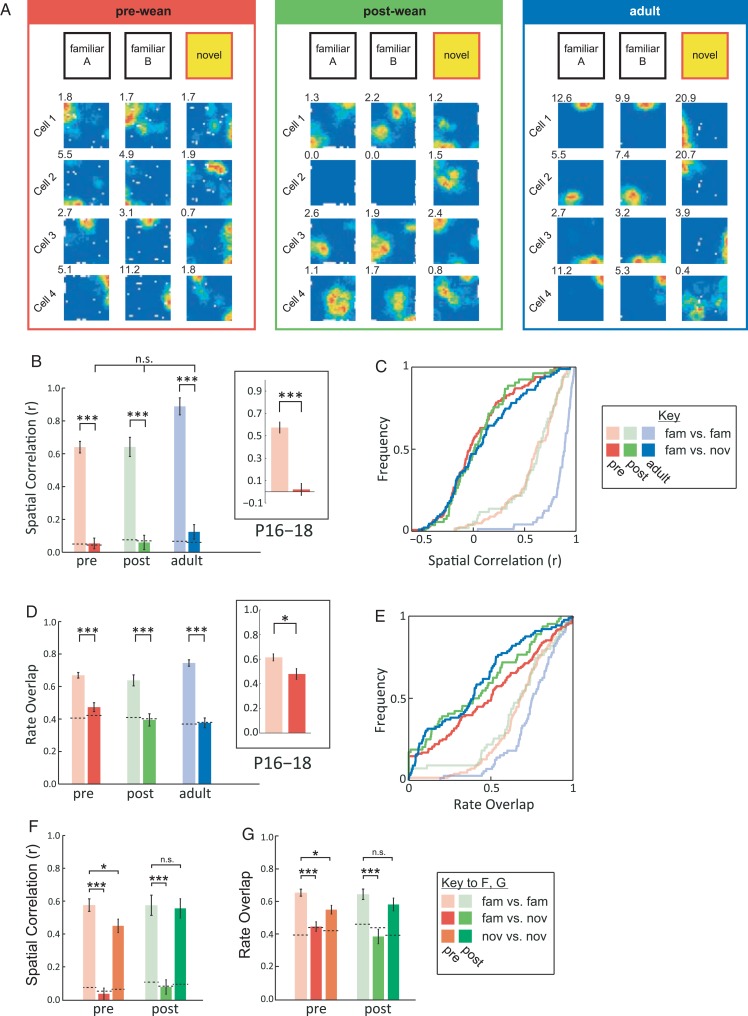
Figure 1.
The place cells of pre-weanling rats undergo global remapping. (A) Examples of place cell ensembles in familiar and novel environment across development. Rate maps for 2 consecutive trials in the familiar environment (“familiar A” and “familiar B”, left) and 1 trial in the novel environment (“novel”, right). Peak firing rates are shown top left of each rate map (Hz). (B) Average spatial correlation (mean ± SEM) across familiar (pale colors) and familiar versus novel environments (bold colors) at different ages (red: pre-wean; green: post-wean; blue: adult). Dotted lines indicate chance levels. Inset shows data for animals aged P16–P18. (C) Same data as B, but shown as cumulative distribution functions (CDFs). (D) Average firing rate overlap (mean ± SEM) across familiar (pale colors) and familiar novel environments (bold colors) at different ages. (E) Same data as D, but shown as CDFs. ***P < 0.001, *P < 0.05. (F,G) Average spatial correlation (F) and rate overlap (G) (mean ± SEM) for those pre- and post-weanling animals exposed to the novel environment for 2 consecutive sessions. Dotted lines indicate chance levels. Average place cell stability within the novel environment is shown in orange (pre-weanling) and dark green (post-weanling), other colors as for B–E.

