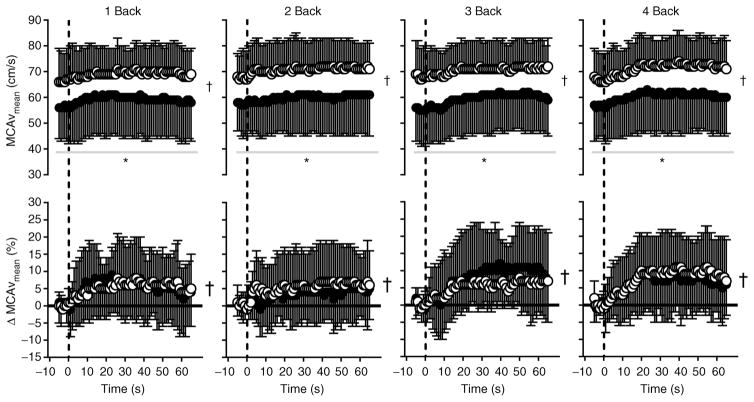
Figure 4. Mean middle cerebral artery blood velocity (MCAVmean) expressed as absolute values (top panels) and as the percentage change from baseline (bottom panels; ΔMCAVmean) over time during 1 Back, 2 Back, 3 Back and 4 Back tests (means ± SD) in normothermia (open circles) and hyperthermia (filled circles).
The vertical dashed line indicates the start of each nBack test; the horizontal continuous black line (in ΔMCAVmean graphs) indicates zero (or no change). *Significantly different (P < 0.001) from normothermia; and †significant (P < 0.001) main effect of time. Owing to the large number of potential comparisons, pairwise comparisons were not conducted in this analysis.

