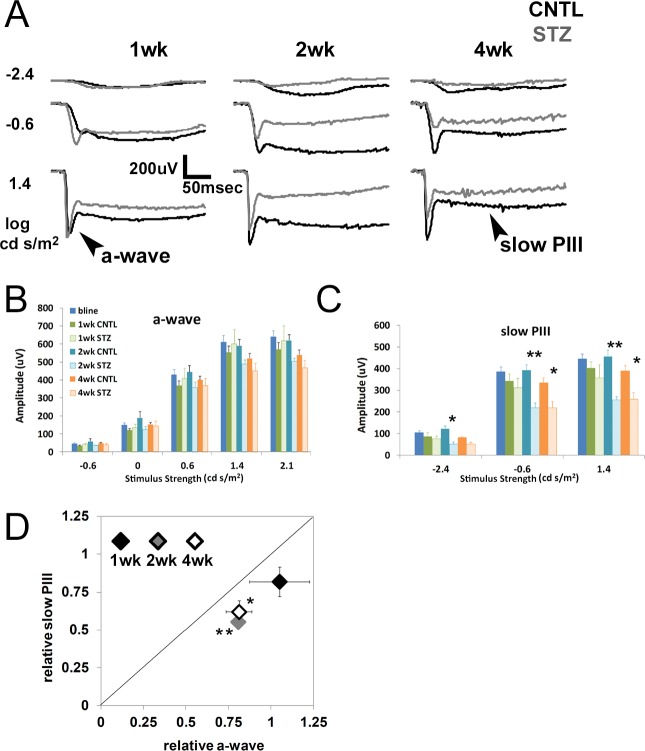
Figure 2.
Diabetic Nyxnob mice exhibit reduced slow PIII and a-wave amplitudes. (A) Averaged strobe flash ERG responses at 1, 2, and 4 weeks following onset of diabetes in response to −2.4, −0.6, and 1.4 log scot cd/m2 flashes. Control waveforms are in black, STZ-injected waveforms in gray. Scale bar: 200 μV/50 ms. (B) Amplitudes of a-waves obtained in response to increasing stimulus strength (−0.6 to 2.1 log scot cd/m2). (C) Average slow PIII amplitudes obtained in response to −2.4, −0.6, and 1.4 log scot cd/m2 flashes. *P ≤ 0.05. **P ≤ 0.005 between CNTL and STZ by 2-way ANOVA with Tukey's post-hoc analysis. (D) Relative change in a-wave and slow PIII amplitudes elicited by the 1.4 log scot cd/m2 stimulus observed in STZ mice plotted relative to the CNTL average response to the same stimulus. The diagonal line indicates an equivalent reduction in a-wave and slow PIII amplitudes. Data points indicate the average ±SEM. *P ≤ 0.05. **P ≤ 0.001 by Student's t-test.

