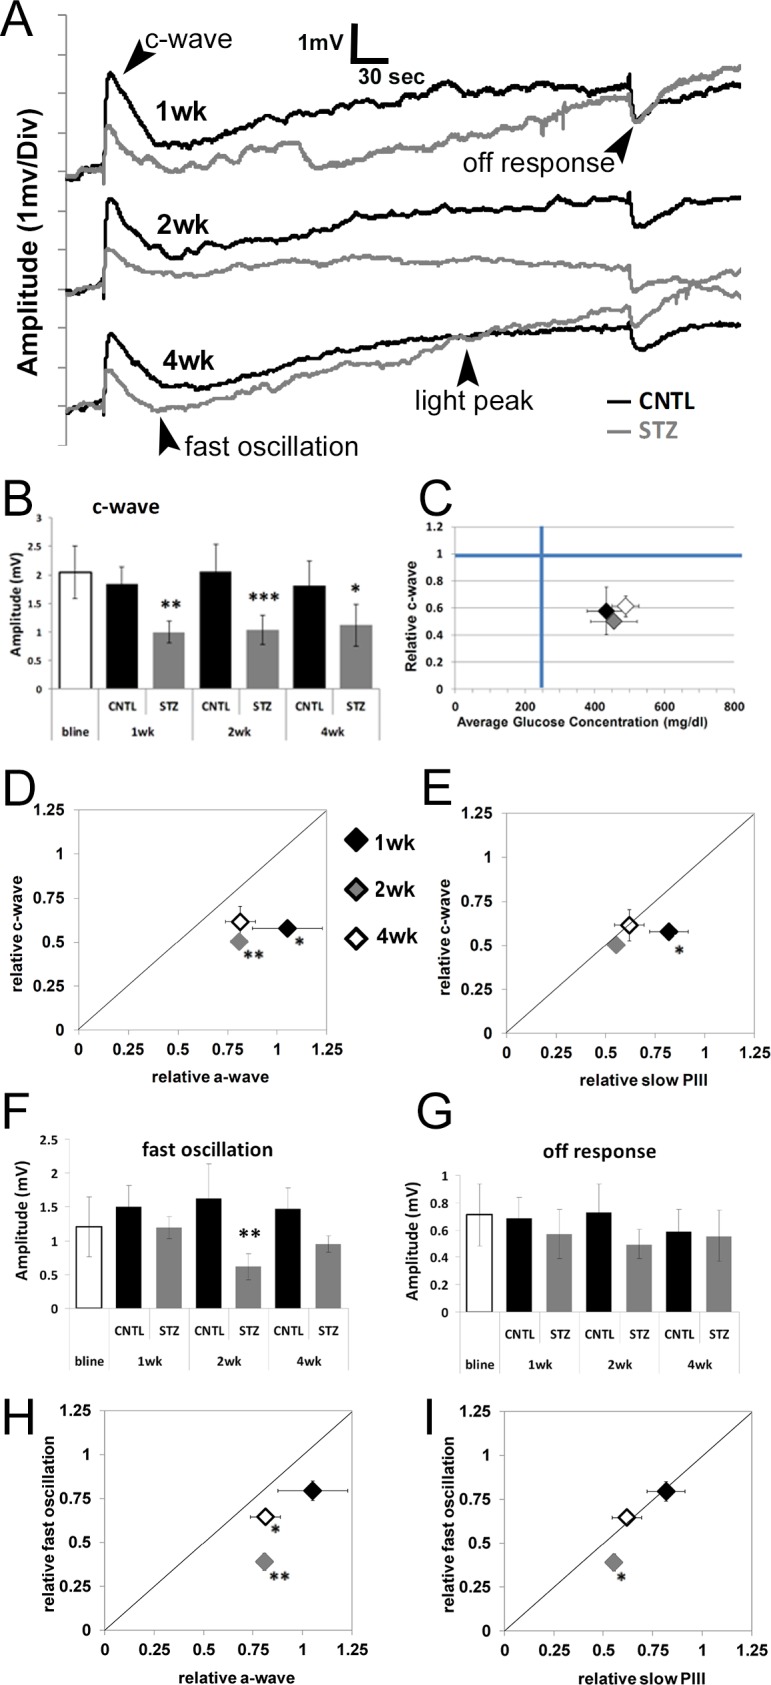
Figure 3.

Diabetic Nyxnob mice display reduced c-wave amplitudes prior to and of a greater extent than a-wave and slow PIII reductions. (A) Representative dc-ERG waveforms from Nyxnob mice at 1, 2, and 4 weeks of diabetes. (B) Average c-wave amplitude at each time point. (C) Relative c-wave amplitude plotted as a function of systemic blood glucose level. (D) Relative c-wave amplitude plotted as a function of the relative a-wave elicited by the 1.4 log scot cd/m2 stimulus at each time point. (E) Relative c-wave amplitude plotted as a function of the relative slow PIII amplitude in response to a 1.4 log scot cd/m2 light stimulus. (F) Average fast oscillation amplitude at each time point. (G) Average off-response amplitude at each time point. (H) Relative fast oscillation amplitude plotted as a function of the relative a-wave elicited in response to the 1.4 log scot cd/m2 light stimulus. (I) Relative fast oscillation amplitude plotted as a function of the relative slow PIII amplitude in response to a 1.4 log scot cd/m2 light stimulus. (B, F, G) *P ≤ 0.05. **P ≤ 0.005. ***P ≤ 0.0001 by 2-way ANOVA with Tukey's post-hoc analysis. (D, E, H, I) *P ≤ 0.05. **P ≤ 0.001 by Student's t-test.
