Figure 5.

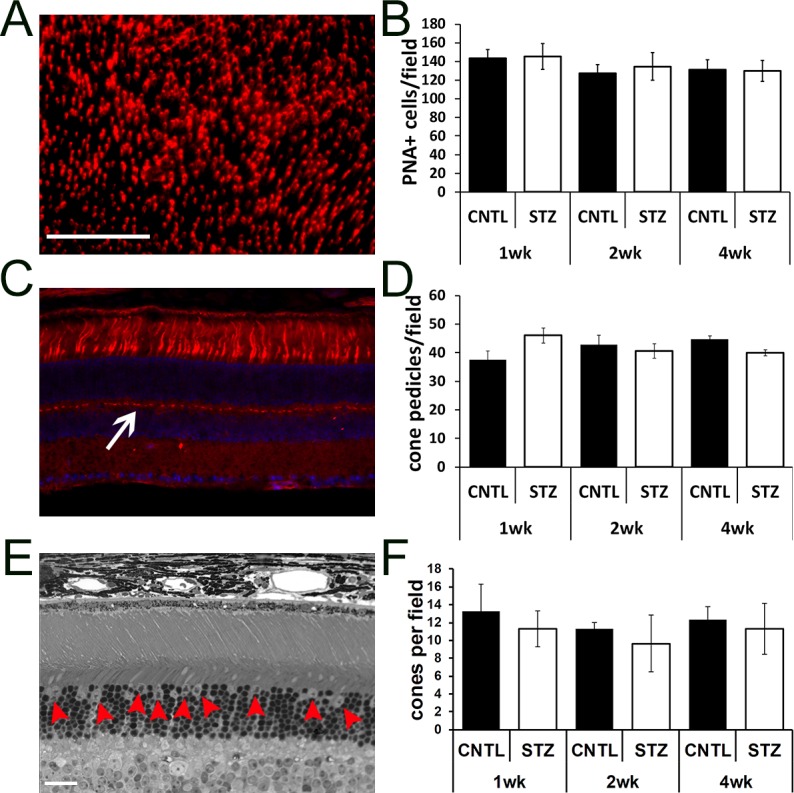
Diabetic Nyxnob mice have normal cone density. (A) Representative retinal flat-mount prepared and stained with PNA. Scale bar: 100 μm. (B) Peanut agglutinin–positive cells/field in each of four petals per flat-mount were counted using ImageJ analysis. (C) Representative cryosection stained with PNA (red) and counterstained with DAPI (blue). (D) Cone pedicles (white arrow) were counted using ImageJ analysis. (E) Representative micrograph from a semi-thin section spanning the optic nerve used for counting cone nuclei (red arrowheads). Scale bar (C, E): 20 μm. (F) Cone nuclei per field were counted and averaged.
