Figure 6.
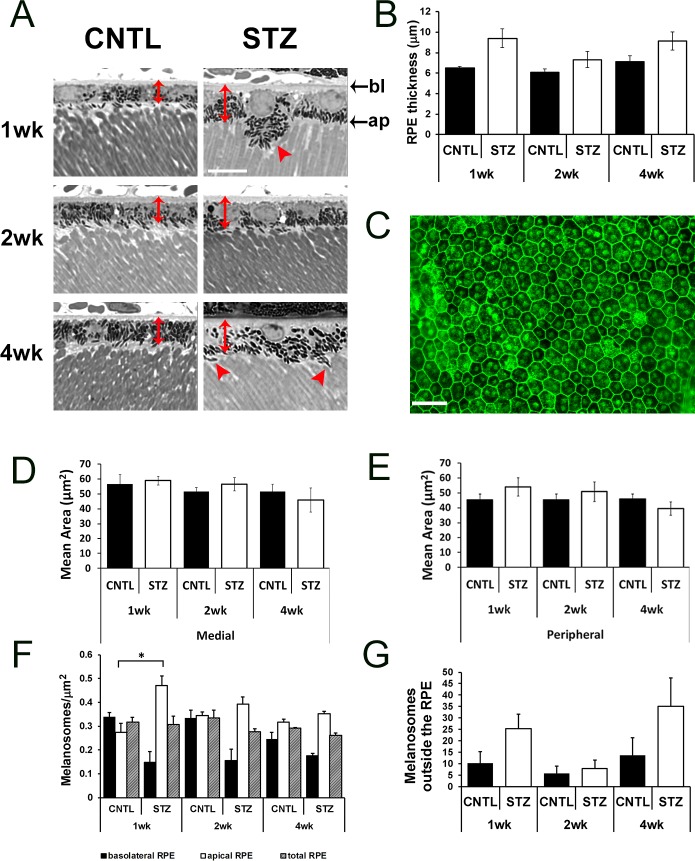
Diabetic Nyxnob mice have enlarged RPE thickness and altered melanosome distribution. (A) Representative micrographs from semi-thin sections used to analyze the RPE. Scale bar: 10 μm. Red, double-headed arrows denote RPE thickness and red arrowheads indicate melanosomes located outside the RPE. (B) Thickness of RPE was measured from semi-thin sections *P ≤ 0.05. **P ≤ 0.005. ***P ≤ 0.0001 by 2-way ANOVA with Tukey's post-hoc analysis. (C) Representative RPE flat-mount prepared and stained with phalloidin. Scale bar: 10 μm. (D–E) Area of RPE was measured from medial and peripheral regions (relative to the optic nerve) in each of four petals from each RPE flat-mount. (F) Melanosomes were counted within bisected apical and basolateral areas identified from micrographs of semi-thin sections of the inferior RPE. Melanosome density was determined from the total area and each bisected region. Bottom: apical (ap). Top: basolateral (bl). (G) Melanosomes found outside of the RPE, in the subretinal space and between outer segments, were counted and averaged for each field.

